Intellicast S3E21 – Schlesinger, 20/20 Research, YouGov and More
April 27, 2020Intellicast S3E22 – Reopening Implications, the Cint-P2 Integration, and Alida Hines
May 1, 2020
In this latest installment of The Sample Landscape, we continue to explore the changes in consumer attitudes and behaviors due to COVID-19, but with a focus on the differences by sample provider. This study was fielded with over 20 sample providers, all balanced on key demographics, so it is an apples to apples comparison. For the sake of this blog, we’re only including 6 of these sample providers for simplicity. However, the differences you see are consistent across all of the providers, similar to what we have seen in other research and you likely have seen yourself.
Note: For all panels tested, n=250m with a 50/50 male/female split and was balanced for age and other demographics
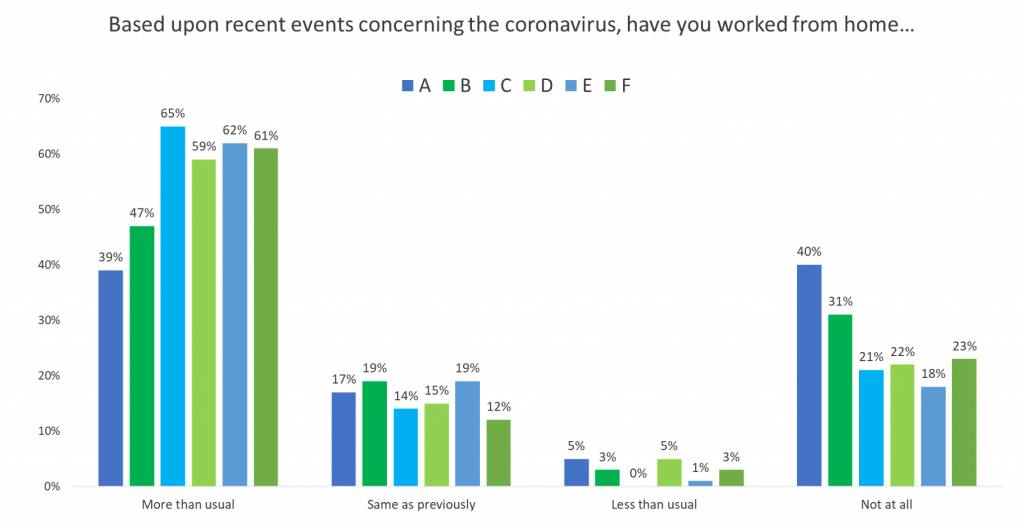
Working From Home
When comparing the results by sample provider on respondents’ working from home habits, we found some significant variance in results. There was a 26-point difference between the panels A and panels C, with panel A less likely to admit to working from home more than usual. Most panels had two-thirds of respondents indicate that they were working from home more than usual.
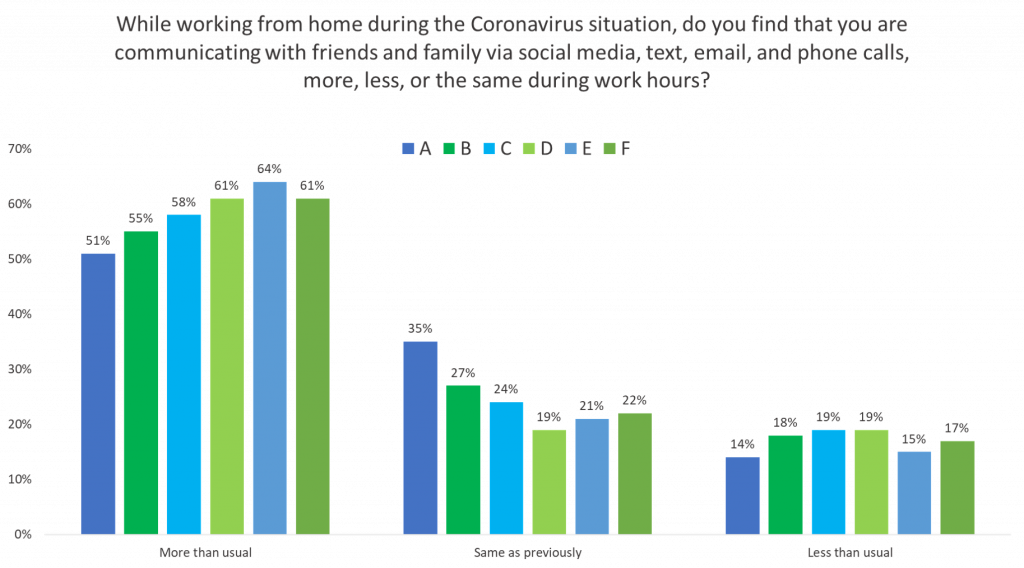
Communication Behaviors
When looking at the communication behaviors, particularly if respondents were communicating with family and friends via digital methods, we found the same variance in results by panel. There is a 13-point difference between the lowest and highest levels of panels saying they communicate more often.
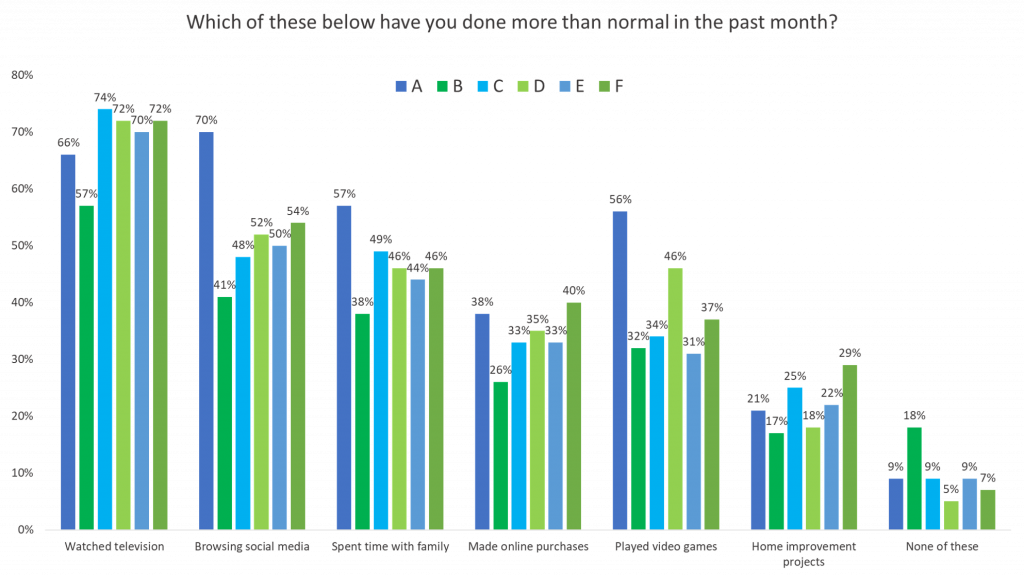
Activity Behaviors
Panels are also inconsistent when asked about activities that are being done more than normal. While Panel A has lower results to the two previous questions, they seem to do more of these activities than other panels. Overall, all panels indicated that compared to other activities, they were watching television more than normal.
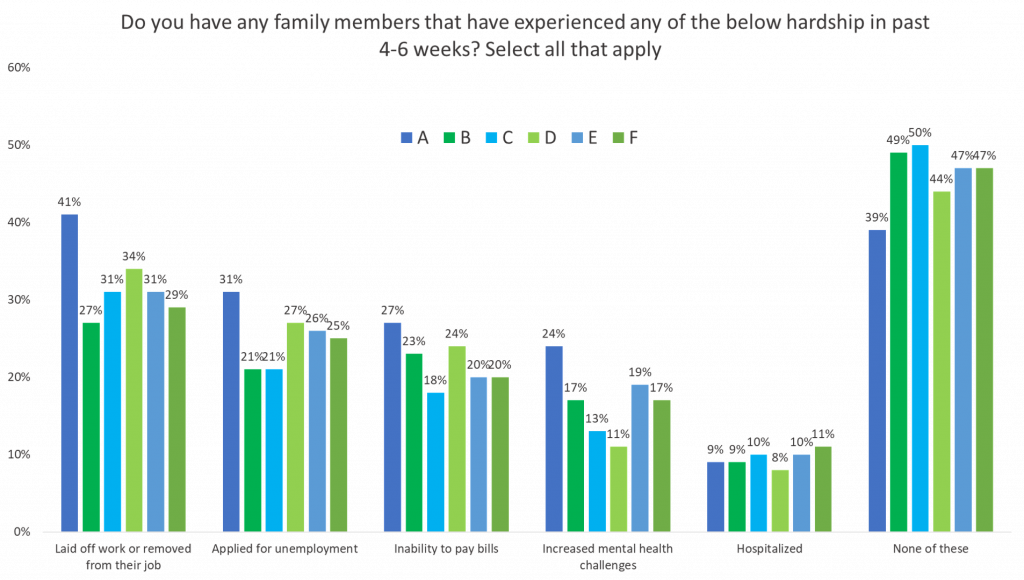
Hardships
Finally, there was variance among the panels when asking about hardships respondents or their families have experienced because of COVID-19. Panel A was the most likely to have respondents that have experienced hardship, across the difference hardships we asked about. Among all panels, roughly 40-50% of respondents indicated that they has not experienced any kind of hardship.
Learn more about our IntelliBlend solution to understand how you can mitigate these differences among panels in your sample blends.
If you missed any earlier installments of our COVID-19 blogs or The Sample Landscape, you can find links to them below:
COVID-19:
- COVID-19 and its Impact on Market Research
- Healthcare Research in the Time of COVID-19
- Response Rates in the Time of COVID-19
- COVID-19 and Age
- COVID-19 and Gender
- COVID-19 and Region
- COVID-19 and Income
The Sample Landscape:


