
Intellicast S3E10 – Schlesinger, X4 and a Quirks Brooklyn Recap
March 9, 2020
COVID-19 and its Impact on Market Research
March 11, 2020
In this latest installment of The Sample Landscape, we will explore some of the findings from our latest round of proprietary research on the sample industry, specifically around voting, the likelihood to vote, and candidate preferences. For this analysis, we are just looking at registered voters.
Voting Likelihood
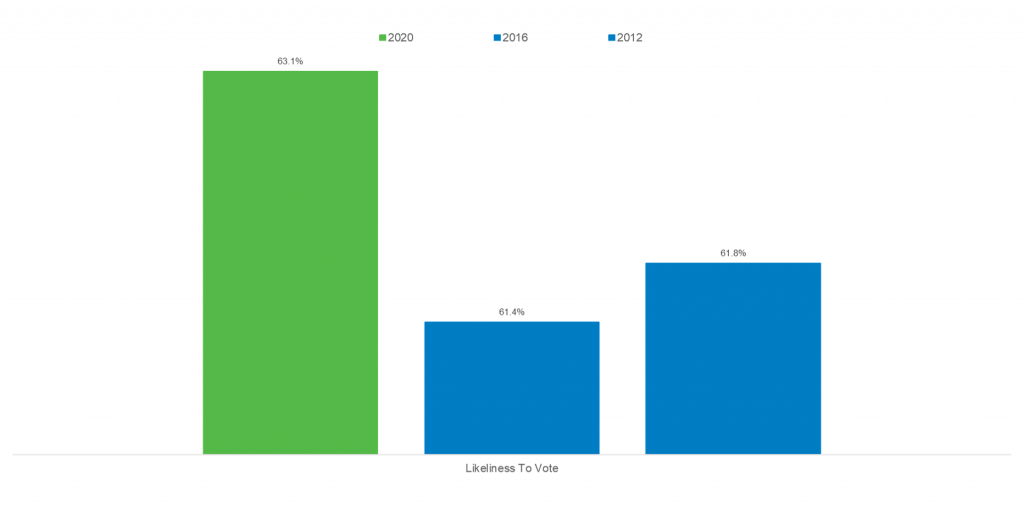
In this study, we ask respondents about their likelihood to vote in the 2020 presidential primary in their state using a 10-point scale, with 1 being not likely at all to 10 being extremely likely. We found that among all respondents, 63.1% claimed they are very likely to vote, which is relatively consistent with both 2012 (61.8%) and 2016 (61.4%) levels.1
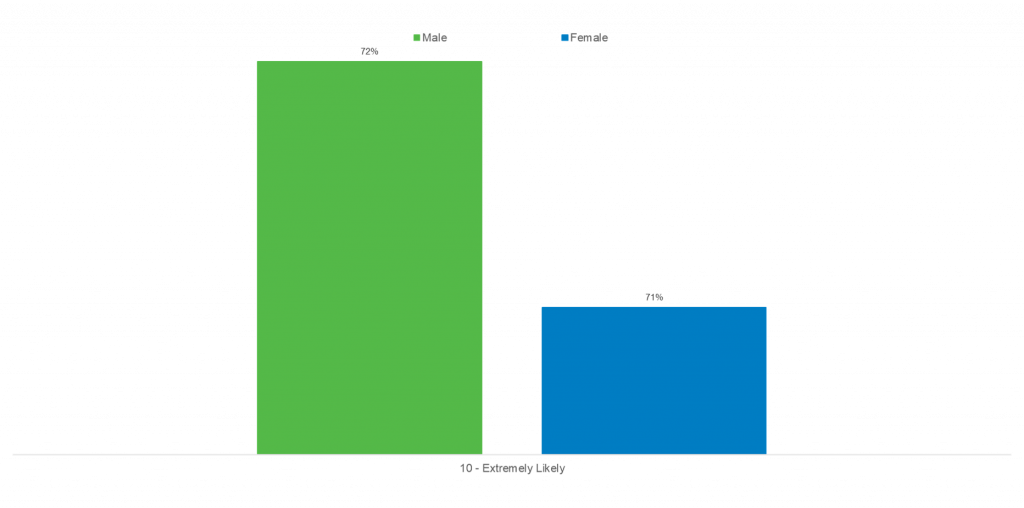
Among registered voters, 72% are extremely likely to vote in their state’s upcoming presidential primary. It is relatively stable by gender, with 72.1% of males and 71.1% of females indicating they are extremely likely to vote.
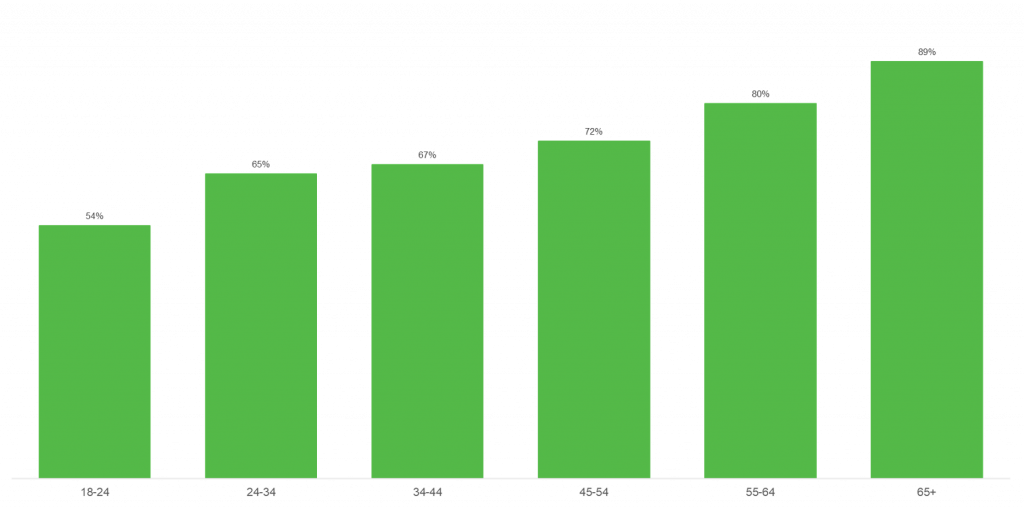
The differences can be found when breaking the results into sub-groups like age, income, etc. When looking at the results by age group, we found that the younger respondent groups are less likely to be certain about voting.
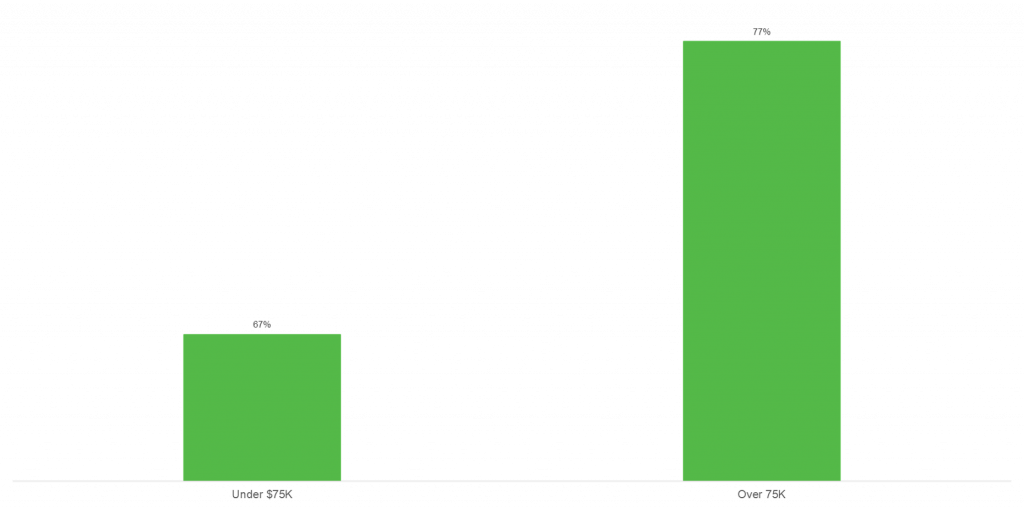
With income, those with smaller incomes are less likely to be confident about voting.
Even by political party affiliation, we found that Republicans are slightly more likely to admit to voting than Democrats.

Comparing to History
With these results in mind, we compared it to historical primary voter turnout. In 2016, the primary voter turnout was 28.5% of eligible voters (US citizens 18+).2 While this is a different metric than what we used for our study, it does highlight the stark contrast of what people say they will do and what actually happens come election day.
This is why it is so challenging to predict presidential elections. The debate around the ideal methodology for accurate polling predictions has been going on for over a couple of decades now. While phone has reigned supreme, their gold standard has started to erode. There have also been a lot of successes with online methodology as a predictor, as it offered several advantages over other methodologies, including:
- Greater Speed – Ability to get in and out of field faster
- Improved Timing – Ability to launch faster and at various times of the day or week
- Additional Data – The ability to add 3rd party data, including voting history, party affiliation, and other attitudes and behaviors to the survey data.
Be sure to keep a lookout for the next installment of The Sample Landscape, where we look into the differences across panels around social issues.
Footnote: Results are based on 2,381 interviews across 21 panels. The data was balanced on age, gender, and race, and is only taking into consideration registered voters (84%).
Sources:


