Optimism or Uncertainty? Americans Look Ahead to Their Financial Future
July 29, 2026
The State of the US Economy: What Americans Are Saying
August 11, 2026
A survey used to be relatively easy to protect from bad actors. A speeder stood out. A straight-liner stood out. Gibberish in an open-ended question stood out. That world is mostly gone now, and most research teams haven’t fully understood the magnitude of the persistent threat.
As technology grew more sophisticated, so did the fraudsters. Today’s fraudsters build believable personas instead of sloppy ones. They run multiple browser profiles, mimic real devices, and answer open-ends in ways that pass a casual review without raising a flag. If your fraud detection strategy hasn’t changed in the past year, it’s built for the fraud we used to see instead of the fraud happening now.
As fraud techniques advance, data quality can take a real hit unless fraud detection protocols change to keep pace. To understand the current state of the industry, our 2026 Sample Landscape Report lays out how these changes have played out. It’s a useful gut-check before you assume your current approach to maintaining data quality still holds water.
The stakes go beyond one messy dataset. Fraudulent responses that slip through don’t just waste field time. They get baked into findings that inform real business decisions.
For example, a tracker with a growing share of fraud can start with small deviations, but larger false shifts can build over time while still eluding detection. The same risk shows up in a single study, just faster, since a one-off project with even a small amount of bad data can point a team toward the wrong conclusion entirely. Catching that gap early is a lot cheaper than catching it after a decision has already been made based on inaccurate data.
Survey Fraud Doesn’t Look Like It Used To
Modern fraud doesn’t come from one type of bad actor. Some rely on bots and scripts to blow through a survey fast. Others use developer tools and browser emulation to look like a dozen different devices from a single machine, resetting local storage between attempts so a survey has no memory of them showing up before. A growing share are simply professional survey takers, real humans completing studies quickly, competently, and dishonestly, over and over.
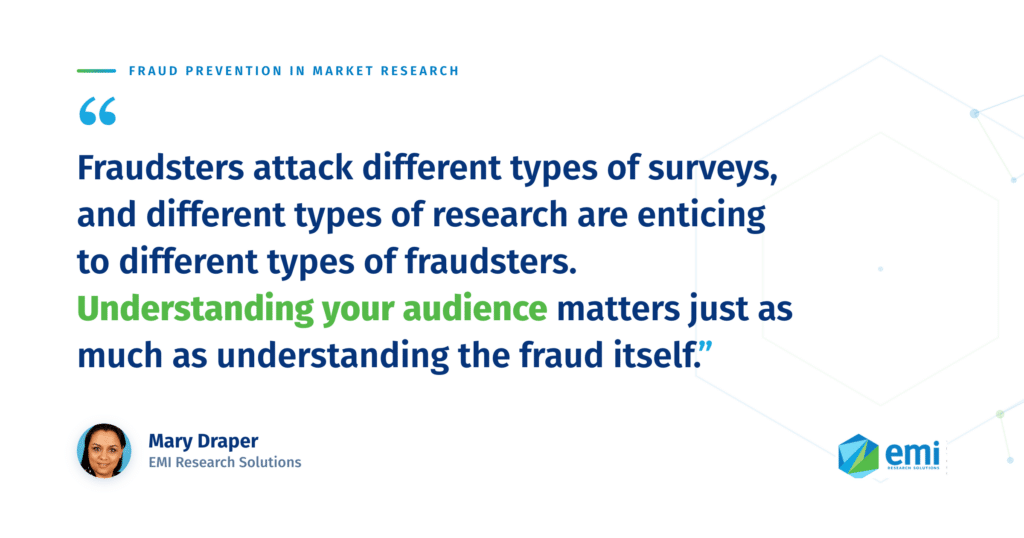
Fraud also isn’t evenly distributed. B2B studies, international audiences, and higher-incentive surveys tend to draw sharper attempts, because the payoff is bigger and legitimate respondents are harder to verify in the first place. A general population consumer study and a niche B2B decision-maker study need very different fraud thresholds, even on the same platform.
Timing matters too. A study can run clean for several waves and then see a sudden spike partway through fielding, often because a link or screener logic got shared somewhere it shouldn’t have. Survey details sometimes end up circulating in forums or messaging groups built specifically to help fraudsters find and pass studies together. A study that looked healthy on Monday can look very different by Friday if that happens.
Even the signals fraudsters leave behind can mislead a team if read in isolation. An outdated browser or operating system might look like an obvious red flag, but plenty of real respondents are simply behind on updates too. What usually separates true fraud from a false positive is the pattern across many signals at once, not any single flag on its own. A fraudster running emulation software tends to produce unusual clusters, like the same outdated setup appearing across many different sessions, rather than the natural variation you’d expect from real people.
Survey design also plays a role in exposing this pattern. B2B and healthcare audiences make the problem harder still, since these respondents are smaller in number and their credentials are tougher to verify at scale. A fraudster claiming to be an IT decision-maker or a physician only needs to sound plausible for a few minutes to pass a lightly guarded screener. That’s part of why niche, high-value audiences deserve tighter scrutiny than a broad consumer study would.
A fraud persona that gets caught by one signal, like an outdated browser flag, simply adjusts and tries again with a different setup. Our SWIFT platform exists for this reason, layering fraud detection, active device fingerprinting, and real-time alerts together instead of relying on any single check. A workaround for one layer runs straight into the next one, rather than a clear path through.
Cracks in Your Fraud Detection Strategy
Building a stronger fraud detection strategy doesn’t require ripping out your current process. It could mean asking a few sharper questions about the one you already have. We suggest gathering your insights team and asking these three questions to start a meaningful conversation.
Are we layering our detection, or just stacking tools? Running several fraud tools side by side isn’t automatically the same as layering them. Real layering means choosing tools that are built to catch different types of fraud, so each one covers the blind spots the others miss. A tool built to flag bot traffic won’t necessarily catch a professional survey taker working through a screener manually, which is why relying on a single solution tends to leave the same gaps open quarter after quarter. Asking your provider which specific fraud types each tool is designed to catch, rather than just naming which tools they use, usually reveals whether real layering is happening.
Could we be blocking good respondents without realizing it? Tightening every threshold as far as it goes can quietly choke off legitimate traffic along with the fraud. Real people sometimes run outdated browsers or unusual setups too, and an overly aggressive system can flag them right alongside the bad actors. Reviewing your raw removal data with your sample provider on a regular basis helps you see whether you’re overcleaning, and whether your thresholds actually match the audience you’re studying. A quick conversation about what’s getting blocked and why often reveals a setting that’s been too strict for months.
Is our survey design doing any of the work? Small adjustments, like refining screener questions, limiting copy-paste behavior, and checking IP-based location signals, raise the bar for fraudsters before a fraud detection tool even gets involved. Occasional video or audio questions can also help confirm a respondent is who they claim to be, especially in harder-to-verify audiences. Involving your sample partner early in survey programming and design, rather than after fielding starts, tends to catch far more than adding tools after the fact. Even a handful of well-placed screener tweaks can meaningfully cut down on the cleanup needed later, without adding much length to the survey itself.
Don’t Let Your Data Quality Strategy Go Stale
None of this works as a one-time fix. Fraud tactics keep shifting, which means thresholds and detection layers need regular retuning rather than a single setup you configure once and forget. Teams that treat data quality as an ongoing practice, not a checkbox, consistently end up with cleaner data and fewer surprises mid-field. That mindset shift matters more than any single tool on the market.
This is especially tricky for lean insights teams juggling multiple projects at once. Building and maintaining an in-house fraud detection strategy takes time most teams simply don’t have. That’s why it helps to lean on a sample partner who’s already staffed, tooled, and constantly retuning for this exact problem, so your team doesn’t have to become fraud detection experts on top of everything else. A good partner should be able to explain what’s being caught and why in plain terms, not just hand over a dashboard and call it done.
Collaboration plays a bigger role in this than most teams expect going in. Sample providers, research teams, and end clients each see a different slice of the same problem, and no single party has the full picture alone. Sharing removal reasons, traffic trends, and flagging thresholds back and forth closes that gap and helps everyone recalibrate together instead of guessing at what the others are seeing. A short, recurring check-in with your provider often surfaces more insight than a quarterly report ever could.
If you’re curious how your current approach compares, we’ve created a Quality Optimization Rating that shows how sample quality gets measured across pre-study, in-study, and post-study removals. It’s a useful benchmark regardless of which sample provider you use, and it’s a quick way to see where your own numbers might be landing relative to the broader industry. The bigger picture, though, comes from understanding where respondent behavior and fraud tactics are headed across the industry as a whole. That’s what the 2026 Sample Landscape Report was built to show, and it’s worth a look regardless of how confident you feel in your current fraud detection setup right now.
Download the 2026 Sample Landscape Report to see where the industry stands today, and what it means for your next study.