

Survey Fraud Is Evolving: Is Your Data Quality Strategy Keeping Up?
July 30, 2026
Who Knows Generative AI? A Look at Platform Familiarity Across Americans
August 11, 2026
If you’ve been following the economic headlines lately, you’ve probably noticed they can feel a bit like Dr. Jekyll and Mr. Hyde. One day, the stock market is reaching new highs. The next, job reports disappoint. Companies announce strong earnings, while social media is filled with stories of a job market that feels tougher than it has since the pandemic.
With so many conflicting signals, it can be difficult to understand how Americans really feel about the economy. In this blog post, we take a closer look at how Americans are currently feeling about the state of the US economy. We break down overall sentiment and explore how opinions differ across key groups, including gender, age, income, race and ethnicity, region, and survey panel. This approach helps provide both a broad snapshot of economic attitudes and a clearer picture of where views diverge most sharply across the population.
Overall
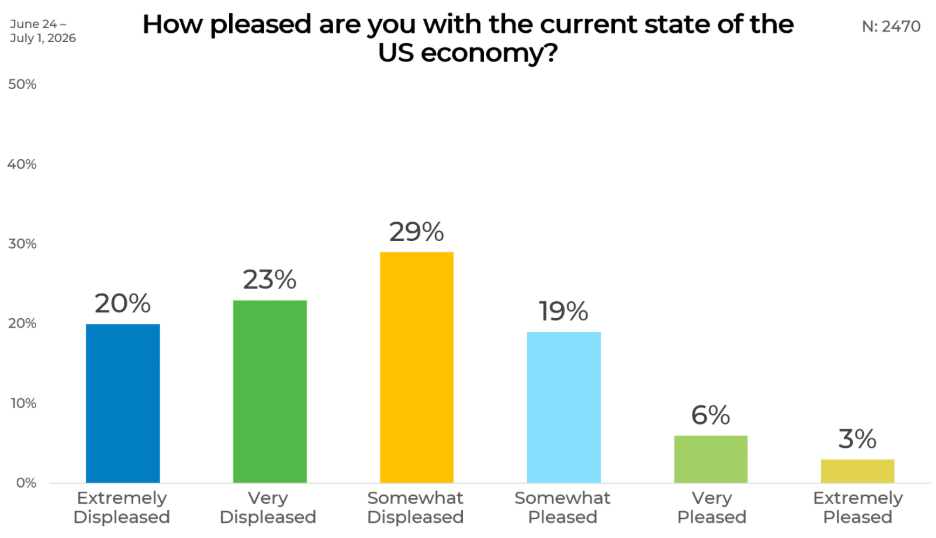
A combined 72% of respondents said they were displeased with the current state of the US economy. This included 20% who were extremely displeased, 23% who were very displeased, and 29% who were somewhat displeased. The largest single response was “somewhat displeased,” although the two stronger levels of dissatisfaction together accounted for 43%.
On the other side of the scale, 28% expressed some level of satisfaction. Nineteen percent were somewhat pleased, 6% were very pleased, and 3% were extremely pleased. Strong satisfaction was therefore relatively uncommon, with only 9% selecting either “very pleased” or “extremely pleased.”
Gender
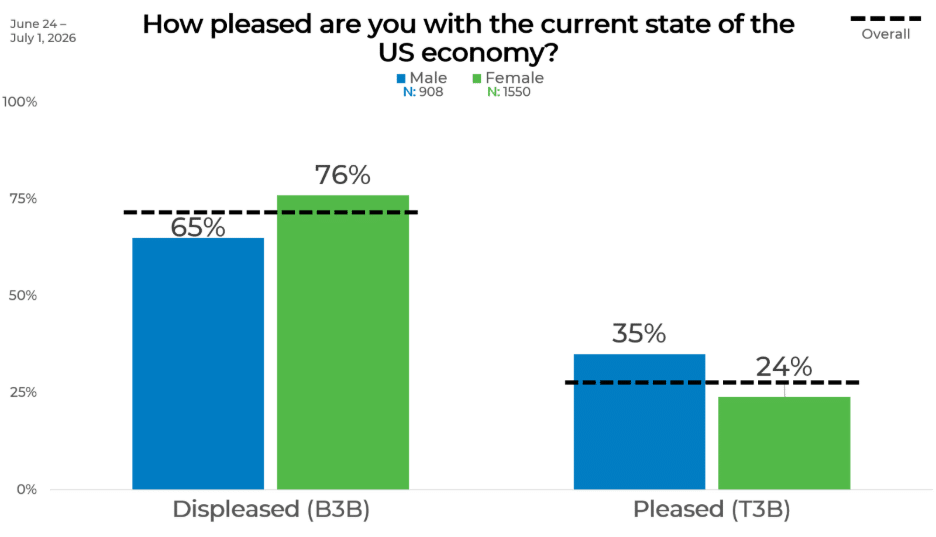
Women reported greater dissatisfaction with the economy than men. Among female respondents, 76% were displeased and 24% were pleased. Among male respondents, 65% were displeased and 35% were pleased.
This produced an 11-point gender gap in both directions. Women were 11 points more likely than men to express displeasure, while men were 11 points more likely than women to report being pleased.
Age
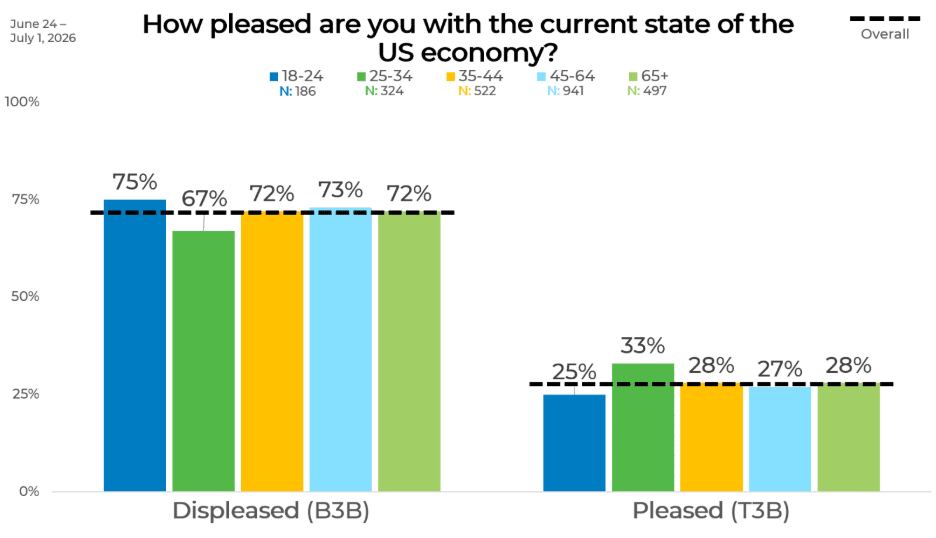
Respondents ages 18 to 24 were the most dissatisfied age group, with 75% displeased and 25% pleased. Adults ages 25 to 34 were the least dissatisfied, although a clear majority of that group still expressed negative views: 67% were displeased and 33% were pleased.
The remaining age groups were closely clustered. Dissatisfaction stood at 72% among those ages 35 to 44, 73% among adults ages 45 to 64, and 72% among those 65 and older. Satisfaction among these groups ranged from 27% to 28%.
Income
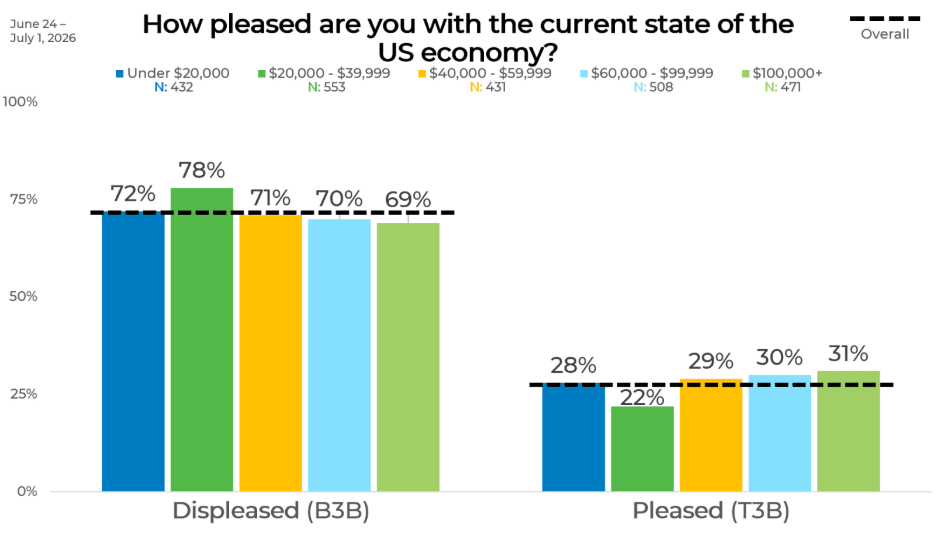
Dissatisfaction was highest among respondents with household incomes between $20,000 and $39,999. In that group, 78% were displeased and 22% were pleased.
The results became somewhat less negative at higher income levels. Among respondents earning $40,000 to $59,999, 71% were displeased, followed by 70% of those earning $60,000 to $99,999 and 69% of those earning $100,000 or more. The highest-income group also reported the greatest satisfaction, at 31%. Respondents earning under $20,000 were near the overall average, with 72% displeased and 28% pleased.
Political Affiliation
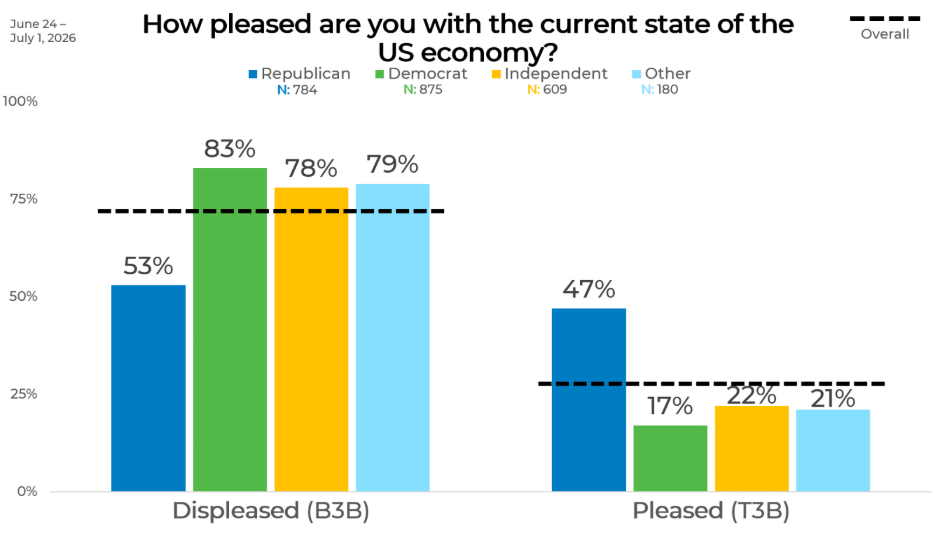
Political affiliation produced some of the widest differences in the data. Democrats were the most dissatisfied group, with 83% displeased and 17% pleased. Independents and respondents identifying with another political affiliation followed closely, at 78% and 79% displeased, respectively.
Republicans stood apart from the other groups. While a majority of Republicans were still displeased, their 53% dissatisfaction level was 30 points lower than the Democratic figure. Republicans were also much more likely to be pleased, at 47%, compared with 17% of Democrats, 22% of Independents, and 21% of respondents in the “Other” category.
Region
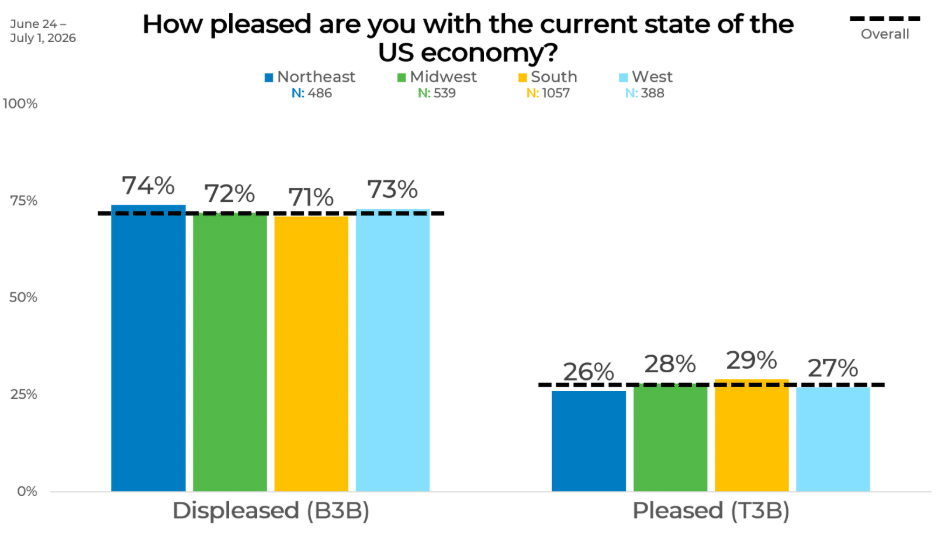
Views were highly consistent across regions. Dissatisfaction ranged from 71% in the South to 74% in the Northeast, a spread of only three percentage points. The Midwest and West fell between those figures, with 72% and 73% displeased, respectively.
Satisfaction showed the same narrow variation. Twenty-nine percent of Southern respondents were pleased, compared with 28% in the Midwest, 27% in the West, and 26% in the Northeast. No region recorded satisfaction above 30%.
Ethnicity
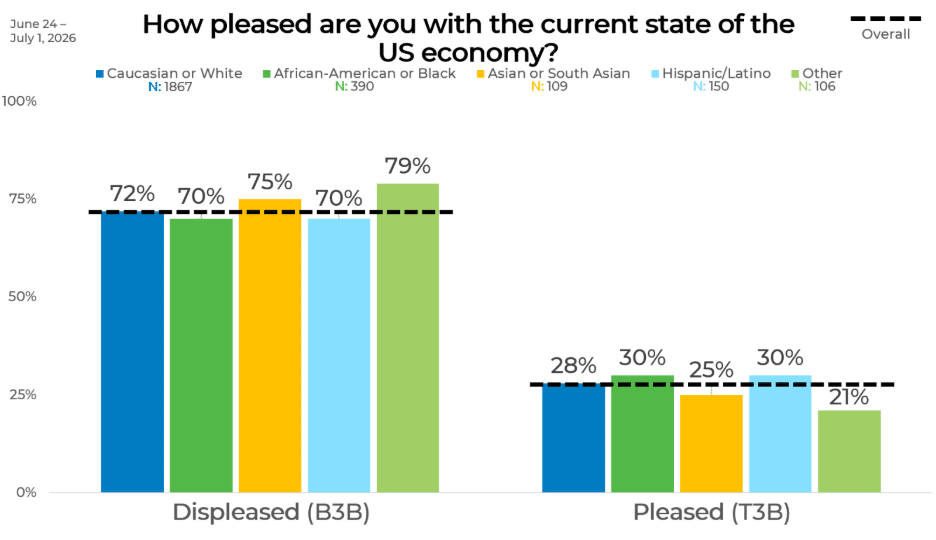
Respondents categorized as “Other” expressed the highest level of dissatisfaction, at 79%, while 21% were pleased. Asian or South Asian respondents followed, with 75% displeased and 25% pleased.
Caucasian or White respondents reported 72% dissatisfaction and 28% satisfaction. African-American or Black and Hispanic/Latino respondents produced identical results, with 70% displeased and 30% pleased in each group. Across all racial and ethnic categories, at least seven in ten respondents expressed displeasure.
Panel
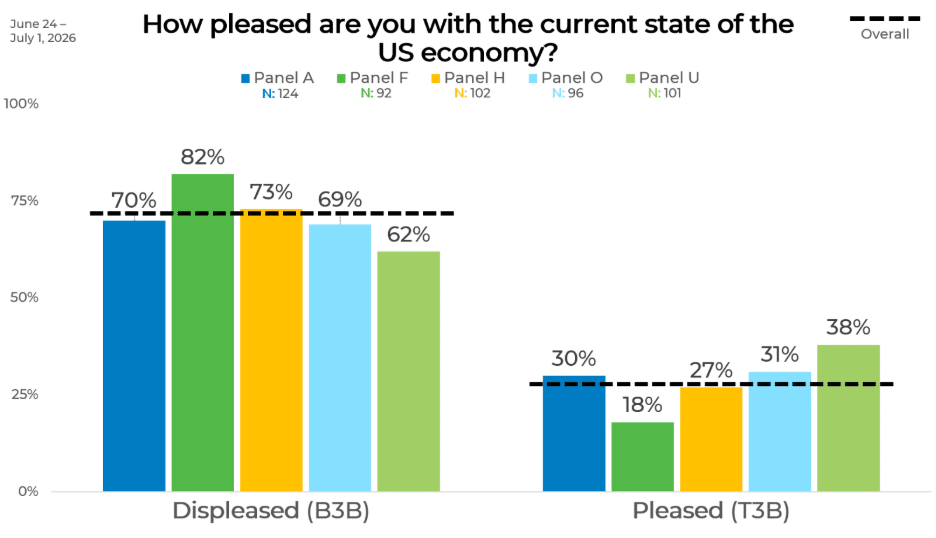
Comparing the panels provides an additional view of how responses varied across different respondent groups. The largest gap appeared between Panel F and Panel U. In Panel F, 82% were displeased and 18% were pleased, while Panel U recorded 62% displeased and 38% pleased. This represented a 20-point difference in dissatisfaction and an equal 20-point difference in satisfaction.
Panel F also stood noticeably above the remaining panels in dissatisfaction. Panel H reported 73% displeased, Panel A recorded 70%, and Panel O recorded 69%. Satisfaction in those panels stood at 27%, 30%, and 31%, respectively. Panel U was the only panel in which satisfaction approached four in ten, although displeasure remained the majority response in every panel.
Wrap up
Overall, the findings show that Americans remain more negative than positive about the current state of the U.S. economy, though the intensity of those views varies across demographic groups and survey panels. While dissatisfaction was the dominant sentiment across every segment, the differences by age, income, race and ethnicity, region, and panel underscore the importance of looking beyond topline results.
Understanding where opinions diverge provides deeper context for interpreting public sentiment and making more informed decisions. As economic conditions continue to evolve, tracking these shifts over time will be essential for organizations, policymakers, and researchers seeking to better understand the perspectives of the American public.