

11 Hours of Media a Day and You Want Them to Take Your Survey?
August 18, 2026
Should I ChatGPT This or Not?
August 28, 2026
AI is integrating itself into nearly every facet of consumers’ lives. It is getting to a point where it is hard to point to activities that generative AI is not touching at some point.
While this is probably true in business, consumer usage still has specific use cases around it. In our recent wave of research-on-research, we explored what activities
Generative AI has quickly become a versatile tool for a wide range of everyday tasks, from creative work to practical problem-solving. In selecting the categories for the demographic graphs, we focused on the five use cases that showed the largest differences across groups, highlighting where usage variation is most pronounced. As adoption has grown, users have increasingly turned to these tools for activities spanning writing, brainstorming, image generation, meal planning, and explaining difficult concepts in simpler terms.
The data is based on consumers who reported using generative AI in the past 30 days.
Overall
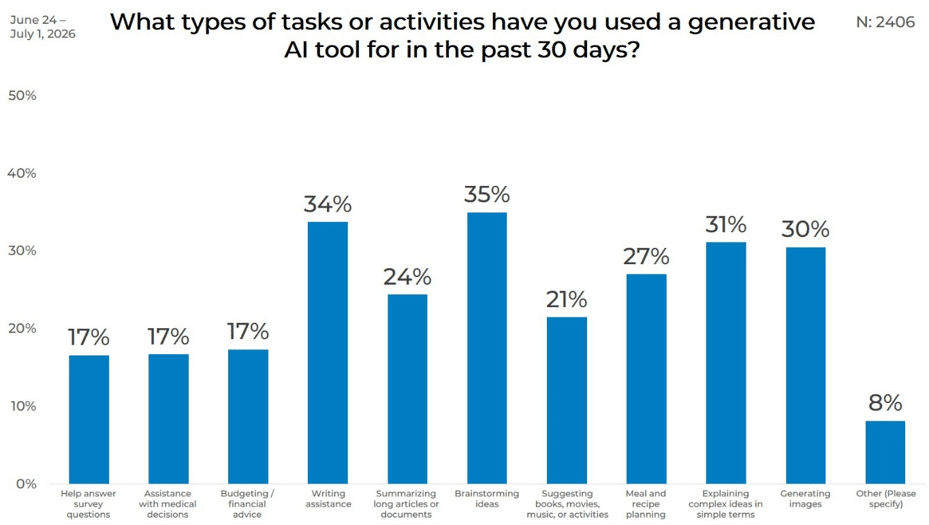
Overall, the highest percentage of US consumers are using generative AI for brainstorming ideas, closely followed by writing assistance and explaining complex ideas in simple terms.
In the secondary usage tier, we found that about a quarter of consumers use generative AI to summarize long articles or documents or to suggest books, movies, music, or activities.
Gender
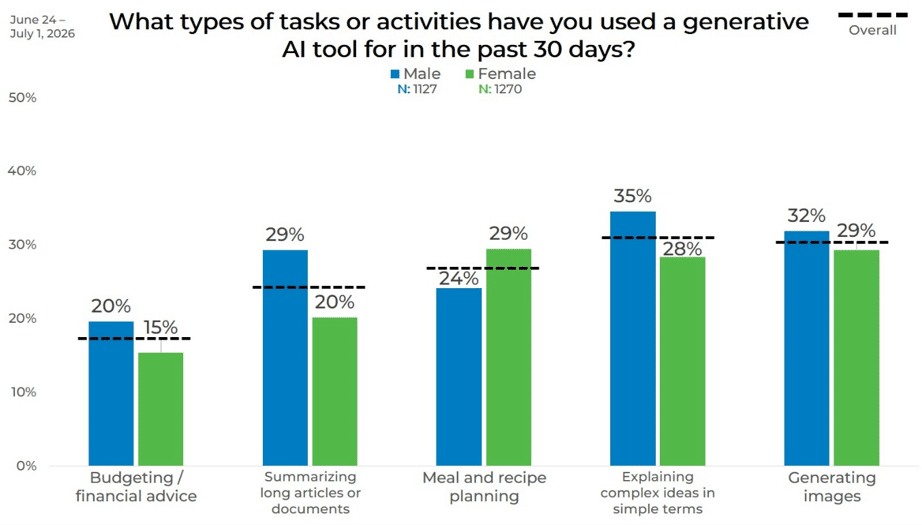
Breaking down the data by gender showed that the largest difference in usage is with summarizing long articles or documents. Twenty-nine percent of men reported using generative AI for this purpose, compared with 20% of women, a nine-point gap. Explaining complex ideas in simple terms also showed a relatively wide difference, at 35% among men and 28% among women.
Men were more likely than women to use generative AI for activities, except for meal and recipe planning, where 5% more women use it for this activity than men.
Age
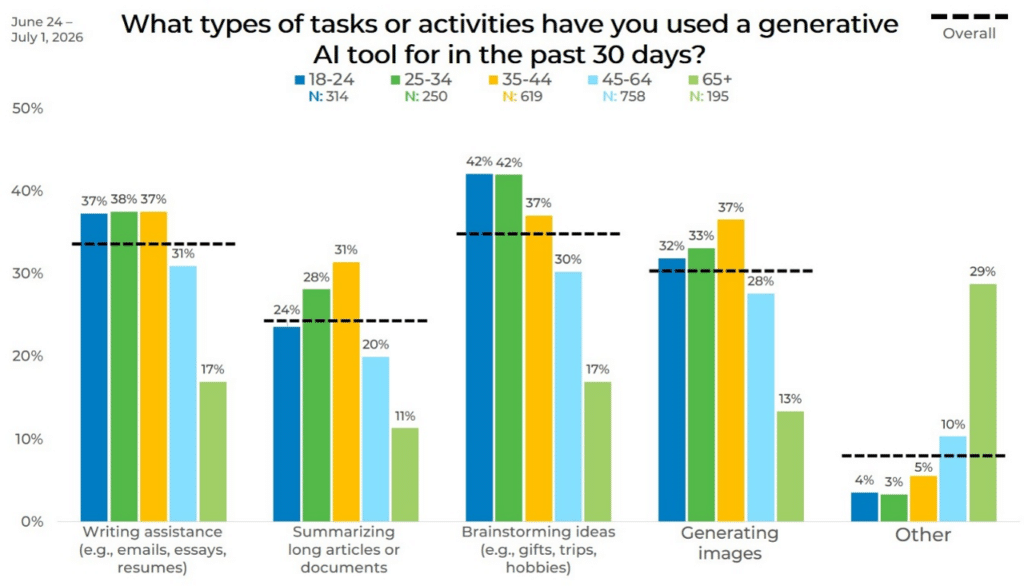
Age has some interesting patterns in the data. For several tasks like writing assistance or brainstorming ideas, we see that 18-to-24-year-olds and 25-to-34-year-olds have near-identical usage. Then the usage drops significantly as you progress to the older age groups.
When using generative AI to summarize long articles and generate images, the data show a different pattern. Consumer usage increases, peaking among 35- to 44-year-olds, then declines among older groups.
Income
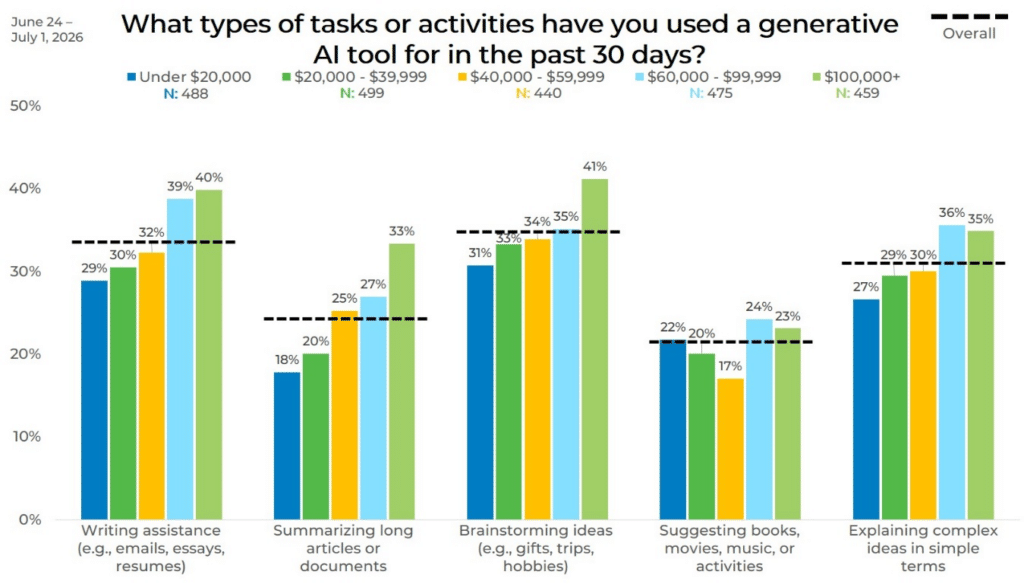
Across nearly all tasks, we see that the percentage of US consumers who use generative AI for that task increases with income. One interesting aspect is that the gap between the highest percentage of consumers and the second-highest is largest when generative AI is used to summarize articles or brainstorm ideas, at 6 and 8 percentage points, respectively.
Political Affiliation
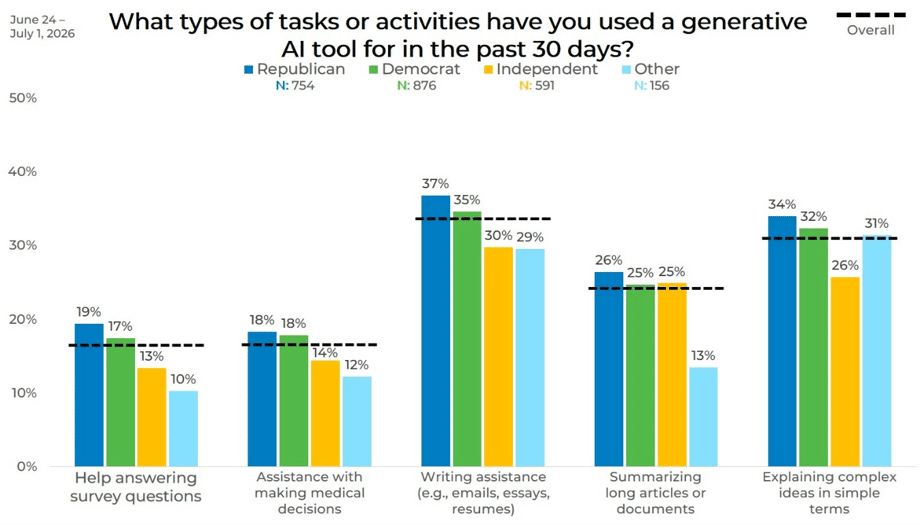
While consumers with different political affiliations often differ on many issues, when we break down the data, we see that their usage across tasks is very similar. The largest gap between Democrats and Republicans for any task is no higher than 2%.
Ethnicity
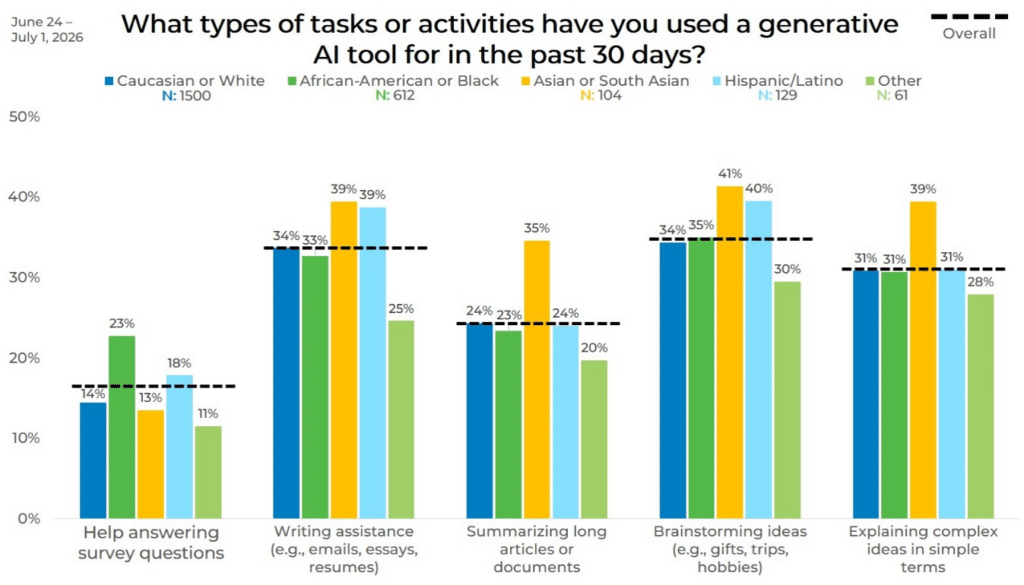
There are significant differences in generative AI usage across certain tasks when the data is broken down by ethnicity. 35% of Asians have used generative AI for summarizing articles, 11 percentage points higher than any other ethnicity.
There is a similar gap in the use of generative AI to explain complex ideas. 39% of Asian report using AI for this task, which is 9 percentage points higher than other ethnicities.
We added “Answer Survey Questions” as a potential task to see how honest people would be. Surprisingly, between 11% and 23% of consumers reported using generative AI to respond to survey questions.
Panel
Differences in who uses generative AI for specific tasks are most pronounced when we segment the data by panel source. Panel A has some of the lowest usage of generative AI for budgeting at 13%, but 49% of respondents use it for writing assistance, more than 10 percentage points higher than any other panel.
Panel T has a similar spike, but with using AI to generate images. 44% of respondents from Panel T use it, 9 points higher than the next panel, and 17 points higher than the lowest.
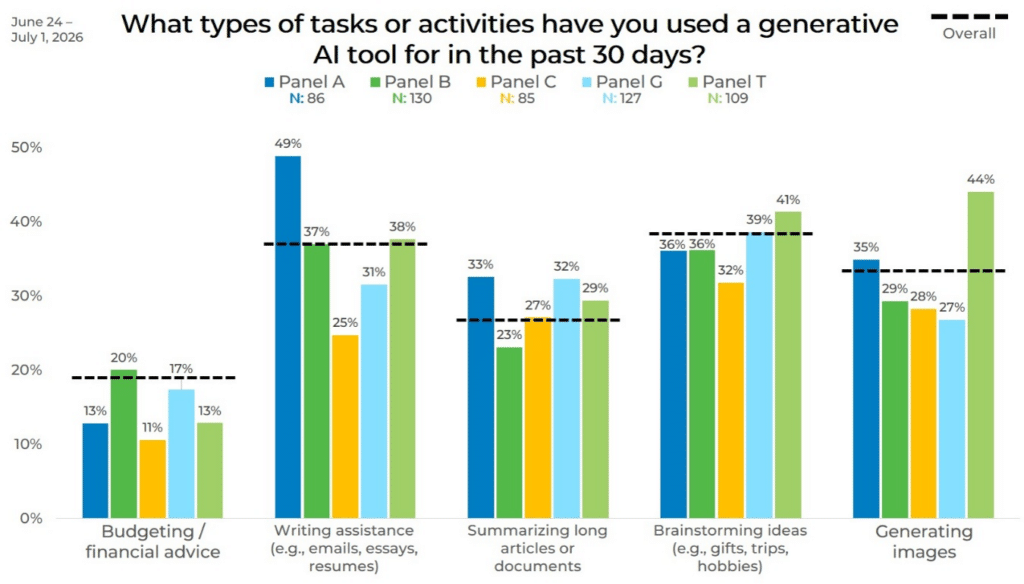
The data highlights the need to strategically blend your sample sources when you are conducting online quantitative research. If you blend a group of panels that are not complementary, you increase the amount of sample bias you introduce into your data.
Click the button below to learn how we can help you mitigate sample bias in your next study.