

3 Observations for a First-Time IIeX Attendee and Speaker
June 5, 2023
Intellicast S6E16– A Slow News Week
June 9, 2023
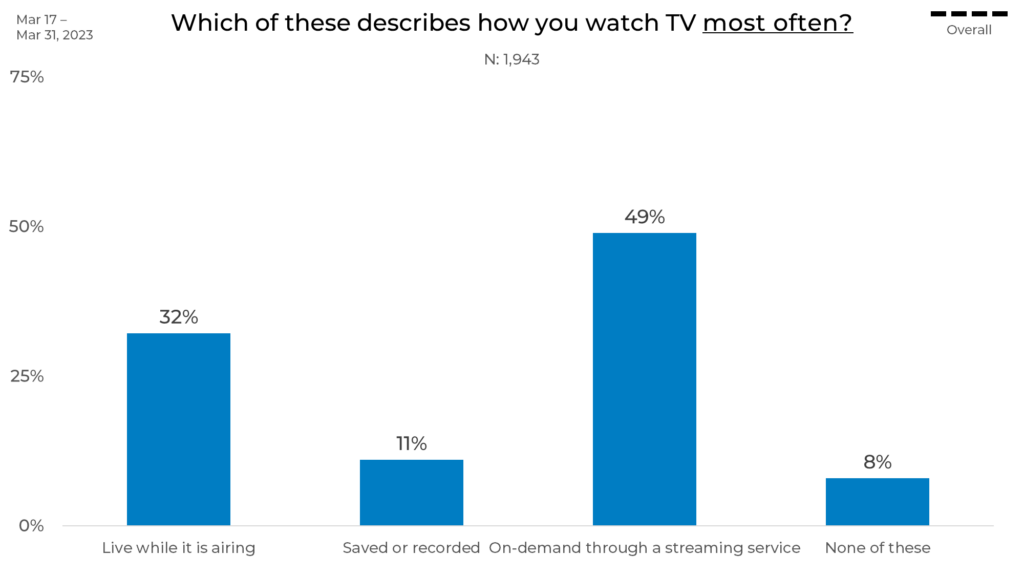
There truly is nothing better than a nice binge-watching session… or is there? Today, there are more streaming services available than ever before and they allow us to watch any show we want, whenever we want. But is this how most people watch TV? In our latest round of research-on-research, we asked respondents about their TV-watching habits.
Overall, we find that people are most likely to watch TV on-demand through a streaming service (17% more likely than watching it live and 38% more likely than watching it recorded.)
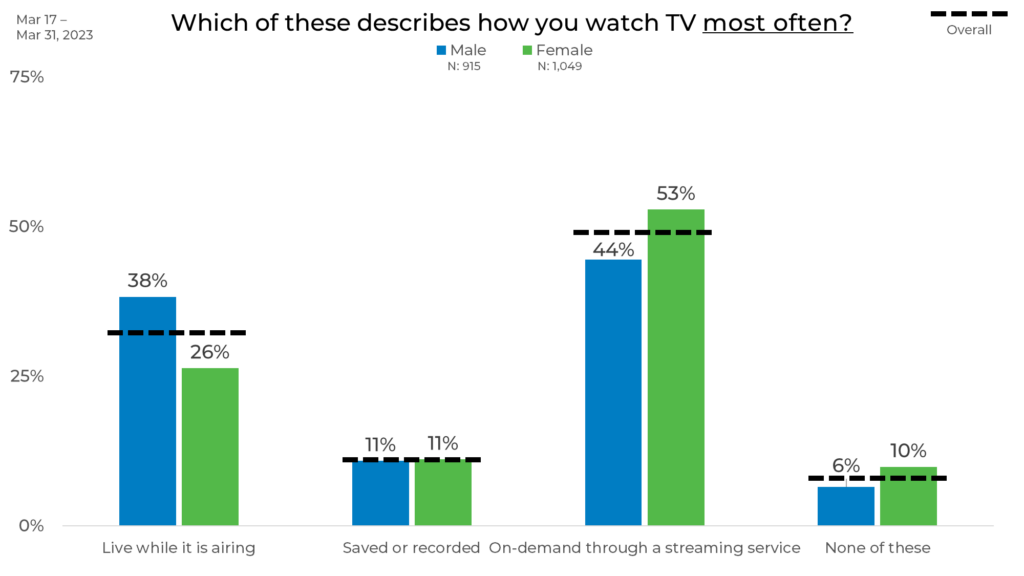
Gender
When looking at response by gender, Males are 12% more likely than females to watch TV live while it is airing. This might be due to males being more likely to watch sports live. Females are 9% more likely than males to watch TV on-demand through a streaming service.
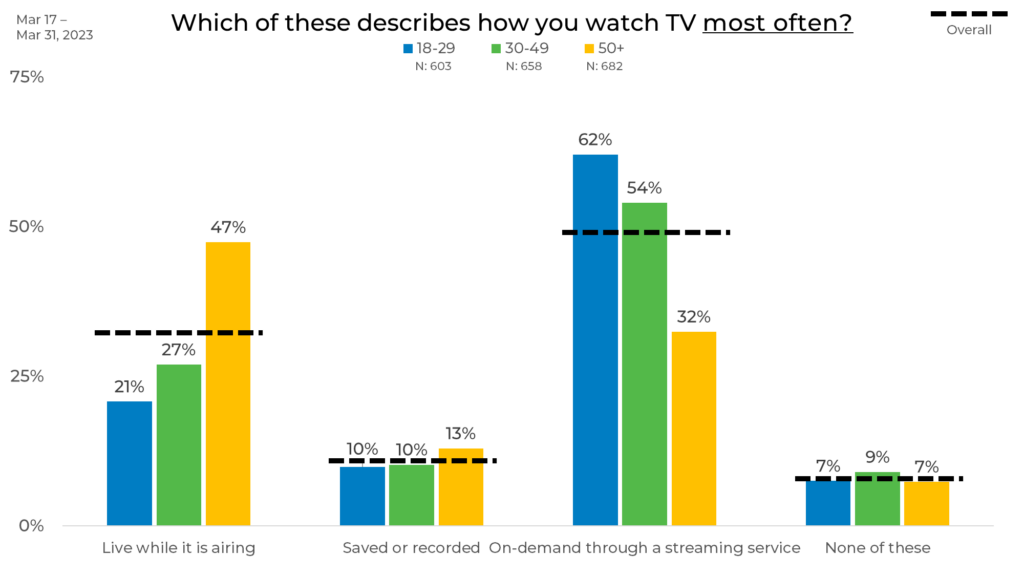
Age
When it comes to age, we find that the older a person is, the more likely they are to watch TV live while it’s airing and the less likely they are to watch TV on-demand through a streaming service. In fact, people over the age of 50 are 16% more likely than people aged 18-29 to watch TV live while it’s airing.
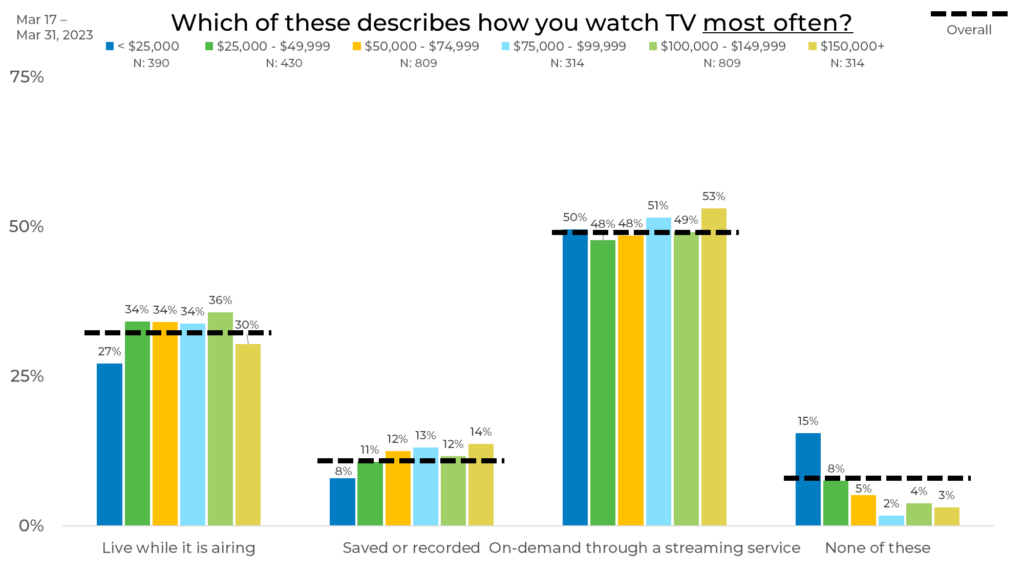
Income
When looking at response by income, we see that people with household incomes below $25,000 are the least likely to watch TV live while it is airing. People with incomes of $150,000+ are most likely to watch TV on-demand through a streaming service. They are also the most likely to watch TV that is saved or recorded.
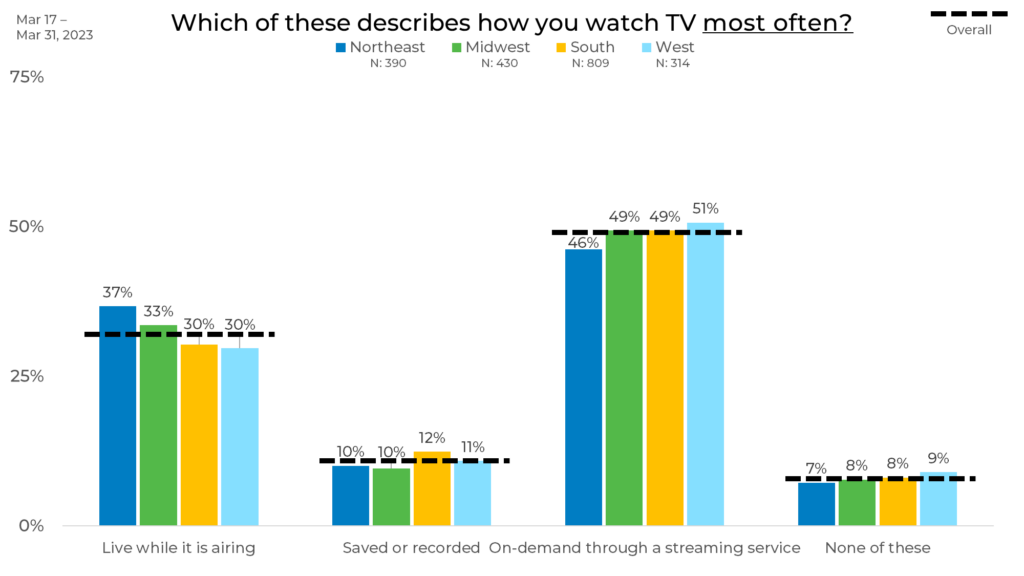
Region
We also wanted to know how TV-watching habits differ by region. Here we see that people in the Northeast are the most likely to watch TV live while it is airing (5% more than the overall average.) People in the West are the most likely to watch TV on-demand through a streaming service.
Panel
Finally, we look at responses by panel. We see up to a 26-percentage-point difference in TV-watching habits between panels. We also see responses up to 16-percentage-points higher and 10-percentage-points lower than the overall average. These variations can be due to differences in panel makeup, management, incentive, and more.
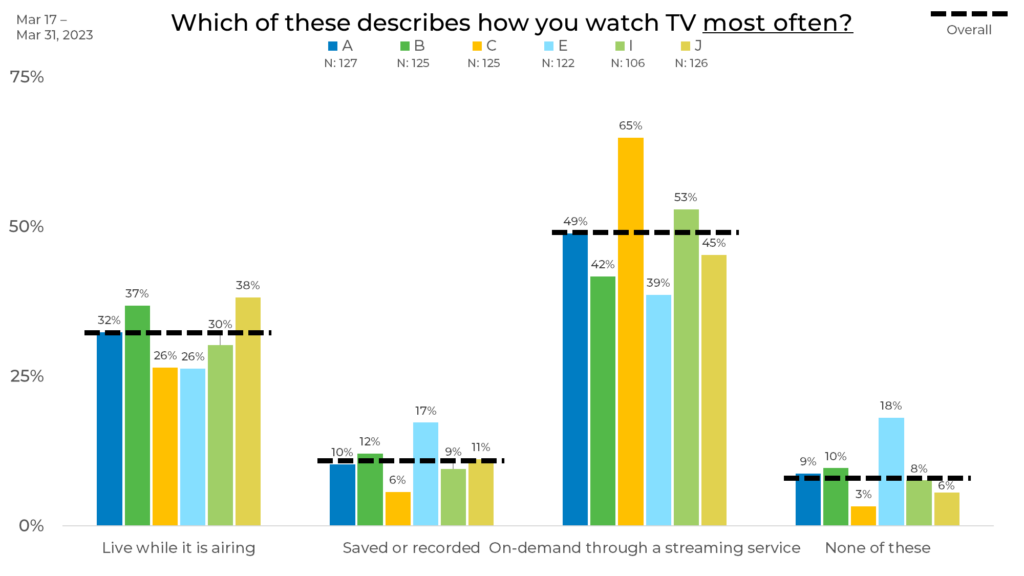
As we see in this blog, consumer attitudes and behavior vary greatly by both demographic and panel. This can have a significant impact on your data. For example, if someone used only Panel C, they might think people are much more likely to watch TV on-demand through a streaming service than actually are. This is why strategic sample blending is the best practice to ensure any changes in your data are due to shifts in the market, not inconsistencies in your data.
To learn more about our research-on-research, check out The Sample Landscape: 2023 Edition!

