
Intellicast S3E37 – Qualtrics, Kantar, Ipsos, and Bubbles
July 29, 2020Intellicast S3E38: Diversity, Virtual Panels, and Accelerated Answers
August 14, 2020
In this installment of our data quality blog series, we are talking about open-ended questions and how they impact your data quality.
Open ends are a great measure of data quality. They can tell you if a respondent is paying attention and answering the questions thoroughly, rushing through and providing unreliable data, or if there are any bots.
By sifting through the open ends, you will find a variety of responses. Categorizing them into groups will help to eliminate the unreliable type of open ends. Looking at the reliability of open ends by panel can also help determine the data quality of each panel.
First, we look at what kind of open-end responses would be flagged:
“698176 98169 81769 817698 7698 17698 71698 1769 817698 71698 17698 1769 8176 98176 9817 6981 6981 96817 96817 6981698 169 817 698 71698 1769.”
“greghewgwgeg”
“h uu-0 0- 0—0”
“nnnnnnnnnnnnnnnnnnn”
“Good morning 🌞😘🌞💓😘”
“IDKKKK EVERYTHING”
“N/A”
“Rheuebeke”
“hi”
“fgfdg fdgfdgfdg fdg d gf fgs dg fdg fdg fg fdgdggfg dfgdsgdfg fdg fgfdgfdg”
“:)$7”
“1001”
“…….”
“😇”
“DIguogsdugod ig di ditudto ots itis sti dutoe ut tdio udot idy utistut std yof diy. dtuo itsuist. utis usti itsui ustuti”
“kkkkkkkkkkkk”
We also keep an eye out for repeated responses, irrelevant responses, profanity, symbols, and random letters and numbers.
Based on those open-end measures, we have determined the number of respondents per panel that have been flagged because of suspicious open-end responses.
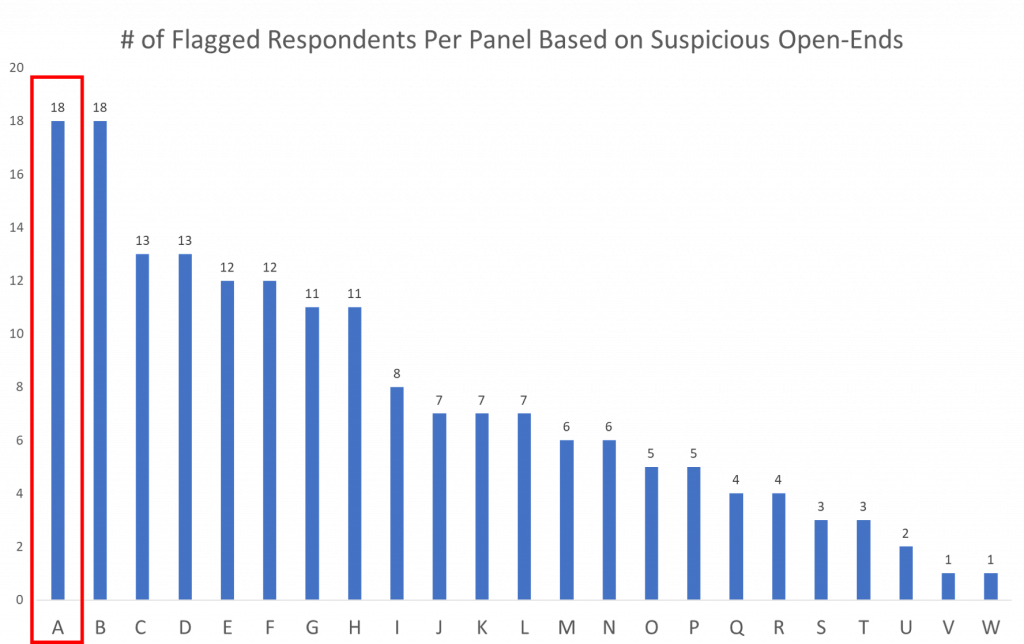
We are looking at Panel A specifically because it is tied for the panel with the largest number of flagged responses based on their open-end responses.
In terms of data quality, Panel A has 18 respondents total that submitted suspicious open ends that caused us to flag them. Here, once those 18 respondents are isolated, we take a deeper dive into the data to see if these respondents were just “bad at open ends” or if they are providing bad data.
Each respondent is given a percentage of total failed data quality checks of the 19 mentioned in our first data quality blog.
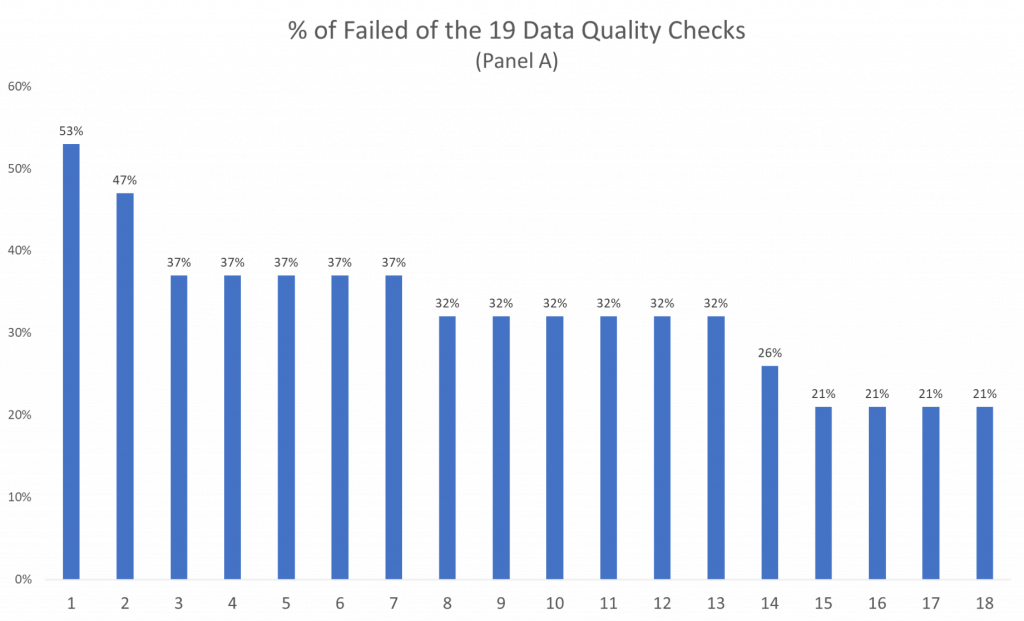
For example, respondent 1 was flagged and has the highest percentage of failed data quality checks—this respondent failed over half of the 19 quality checks (over 10.)
On the other hand, respondents 15, 16, 17, and 18 were also flagged for their open ends, but only failed 21% of the 19 data quality checks (only about 4 of the 19 total.)
Overall, Panel A averages 32% failed data quality checks based on the 18 respondents flagged for their open ends.
Taking the average failed data quality checks for each panel gives us a big picture of the kind of open-ends each panel is providing and helps us to isolate which respondents are unreliable vs those that might have simply made a mistake when answering a question or typing a response. It also helps us distinguish the reliability of panels in general by giving us a big picture of the type of data panels are providing us.
It also helps us determine whether a panel is providing only a few respondents that fail large numbers of data quality checks, meaning that those few respondents might be bots, or providing a large number or respondents that fail very few data quality checks.
While this data can be very useful, it is important to take a closer look at each of the respondents before any decisions are made about removing a respondent.
Once this information is available, you can dive even deeper into the data and discover exactly which data quality checks were failed and use that additional information to decide if the respondent should be removed, rather than making the decision based on only one data quality measure.
The goal of all of these data quality measures and analyzing this data so deeply is to make the most informed decisions about the data as possible so that we can provide the most accurate and reliable data there is. In turn, more accurate decisions can be made, resulting in better outcomes for everyone.
To read the previous installments in our Data Quality series, follow these links:
An Introduction to Data Quality Checks and Their Use Determining Data Quality
When It Comes to Data Quality—Not All Panels are Equal
Data Quality—Demographic Differences
Changes in Attitudes and Behaviors and How they Impact Data Quality


