
Intellicast S3E36: GRIT Report and a Publix Update
July 22, 2020Intellicast S3E37 – Qualtrics, Kantar, Ipsos, and Bubbles
July 29, 2020
In this installment of our Data Quality blog series, we are looking at data quality and how it is impacted by changes in attitudes and behaviors.
In continuation with our previous blogs in this series, analyzing this information will help us to profile respondents who are most likely to provide fraudulent data. Looking at this data also helps us to put into perspective the effect that fraudulent data has on the data overall, meaning that by looking at the data specific to the respondents that failed the most data quality checks, we can understand what effect their data has on the overall total data.
You will see an example of this in the following graphs:
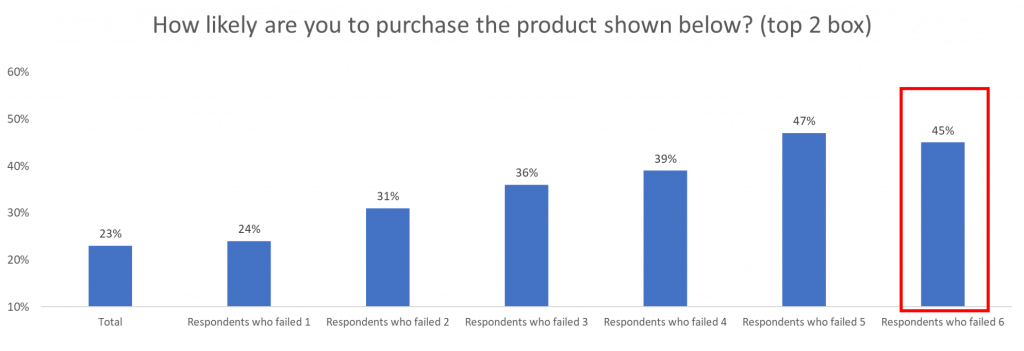

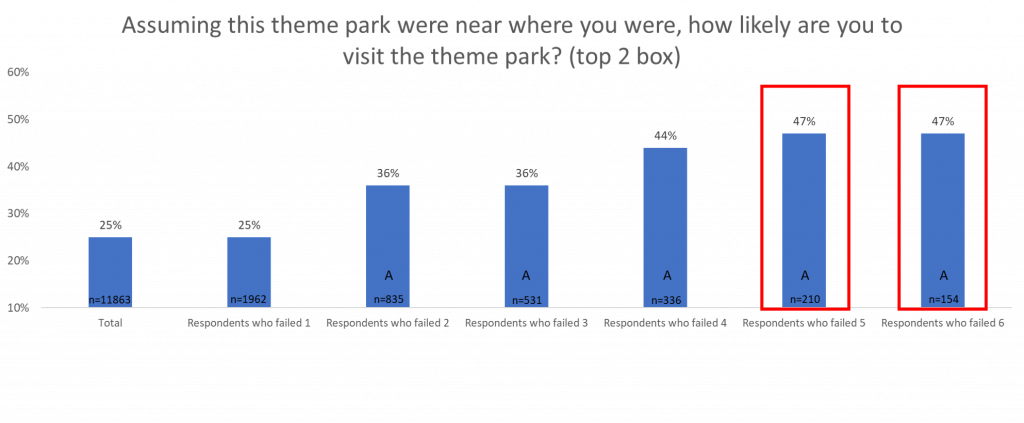

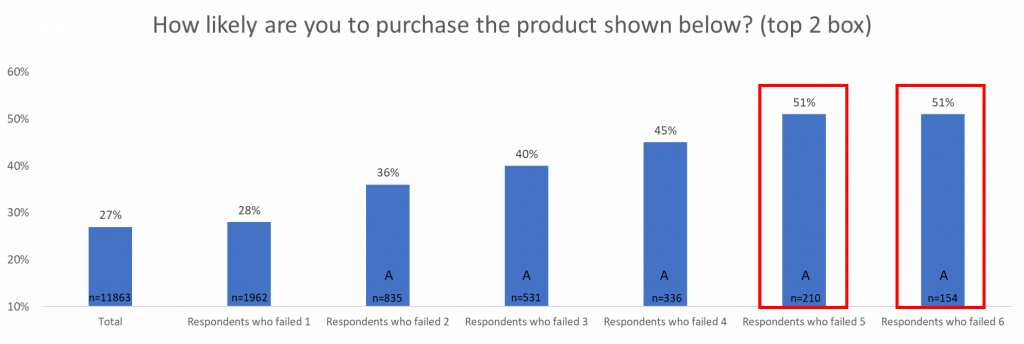
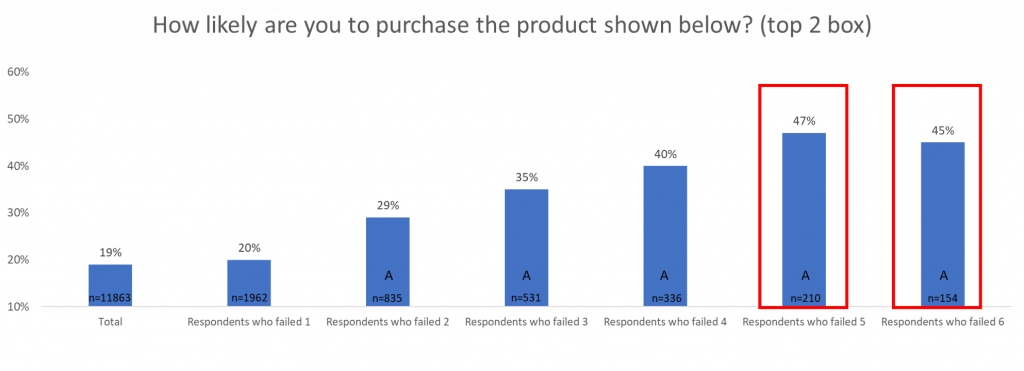

As you can see in the charts, the more failed data quality checks, the more willing a respondent is to try a product.
This will lead to an overestimate of people willing to try the product because the respondents that say that they are most willing to try a product are also the ones that are submitting the most ‘bad data.’
This is important because business decisions made based on false data can be time-consuming, as well as financially draining. If we were to remove respondents who failed 6 or more data quality checks, the overall willingness of respondents would lower and potentially influence the business decisions being made.
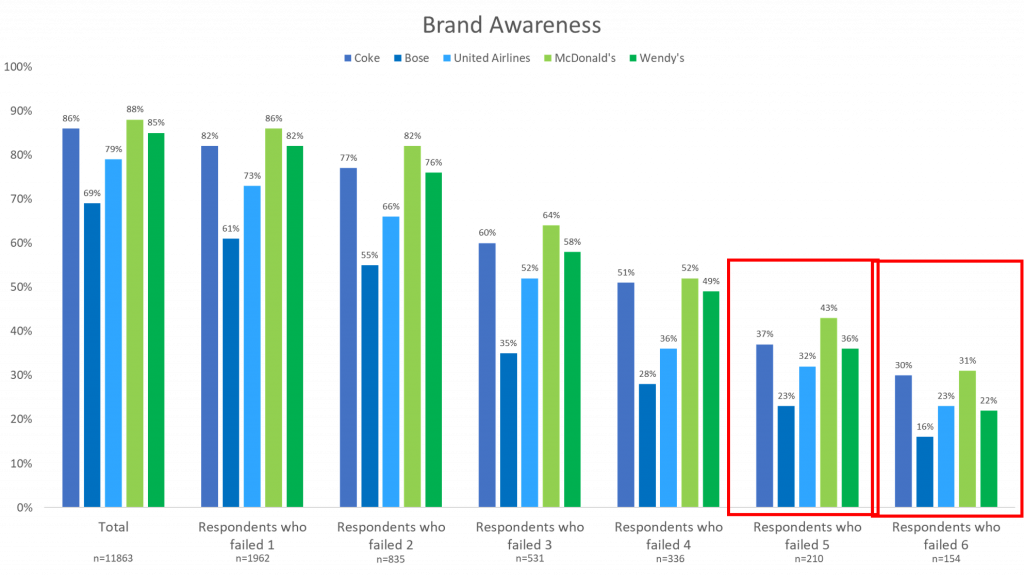
Brand Awareness
Of the respondents that failed 6 data quality checks, brand awareness for all five brands was significantly lower than the total. This tells us that the respondents who are most likely providing accurate data are more likely to have a lower level of brand awareness.
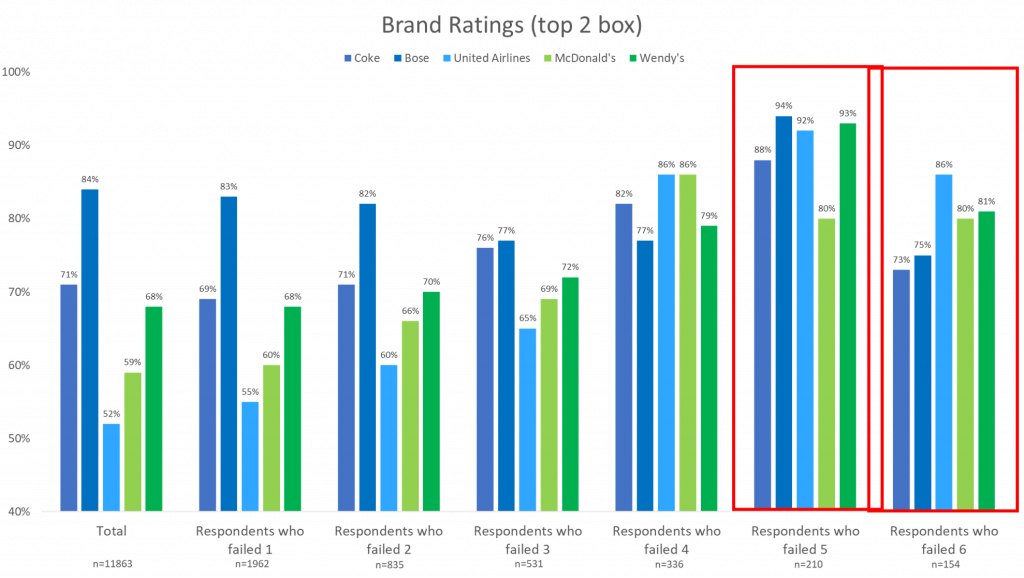
Brand Ratings
When looking at brand ratings, the more data quality checks a respondent failed, the more likely they are to rate a brand highly. This tells us that if we were to remove respondents who failed more data quality checks, the total brand ratings would be lower for all five brands.
Again, by including respondents who have failed a significant number of data quality checks, the overall brand awareness is underestimated, and the overall brand rating is overestimated. When bad data pulls the total in one direction, the total does not accurately reflect the feelings of the respondents because that data is unreliable. That is why it is so important that data quality is measured and analyzed so that business decisions are made based on the most accurate data possible.
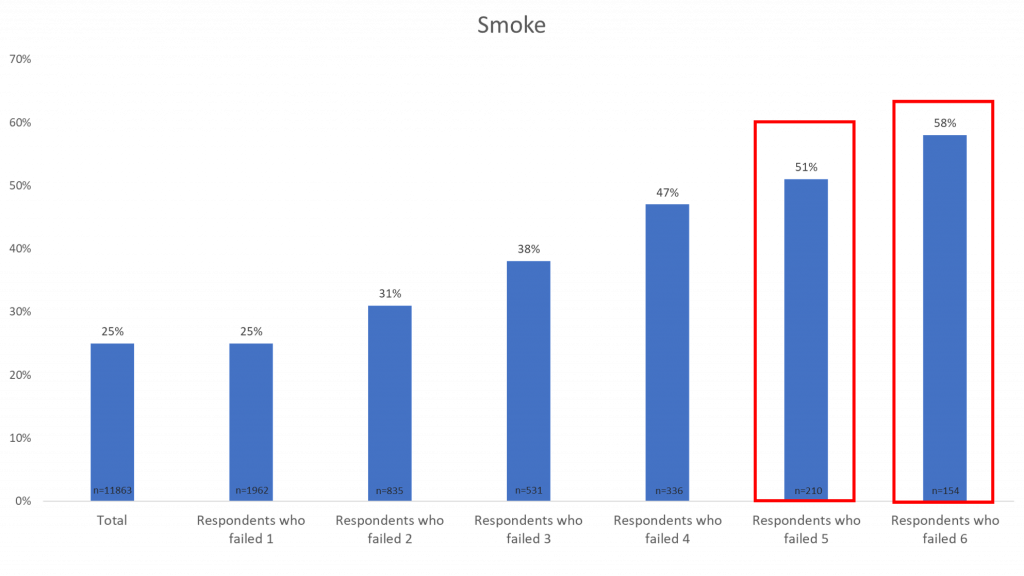
Smokers
The more respondents fail the data quality checks, the more likely they are to smoke cigarettes. If we were to remove respondents who failed multiple data quality checks, the number of respondents who claim to smoke would decrease.
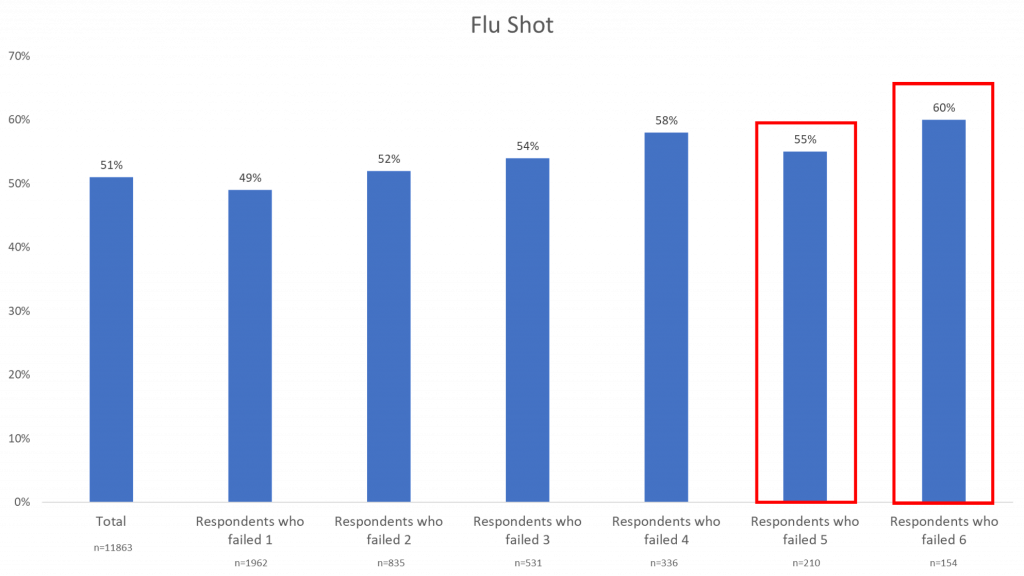
Flu Shot
The flu shot data stays mostly consistent, only a slight increase as the number of data quality checks failed increases.
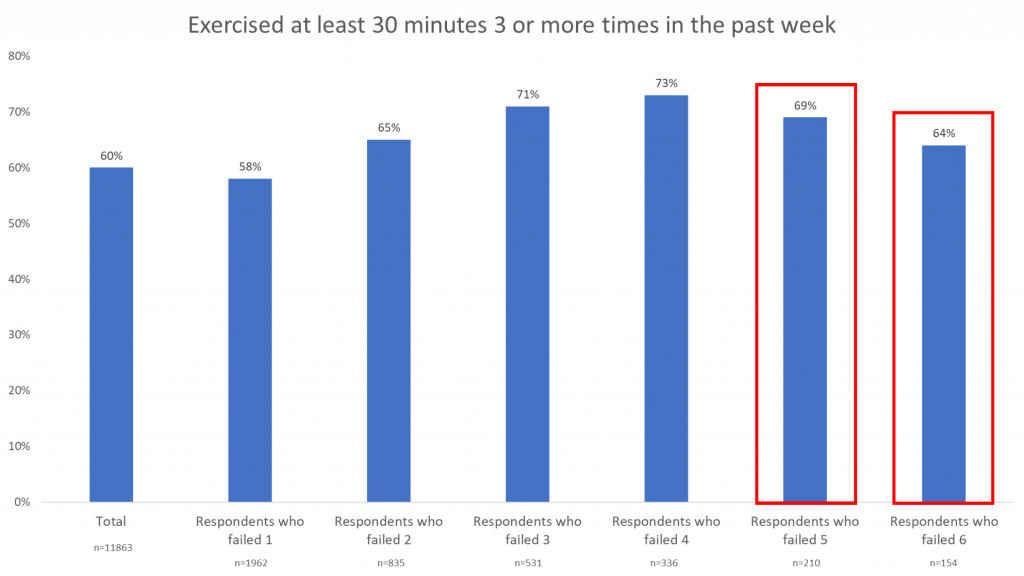
Exercise
Like the flu shot data, there is a slight increase in the number of respondents who claim to exercise as the number of failed data quality checks increases.
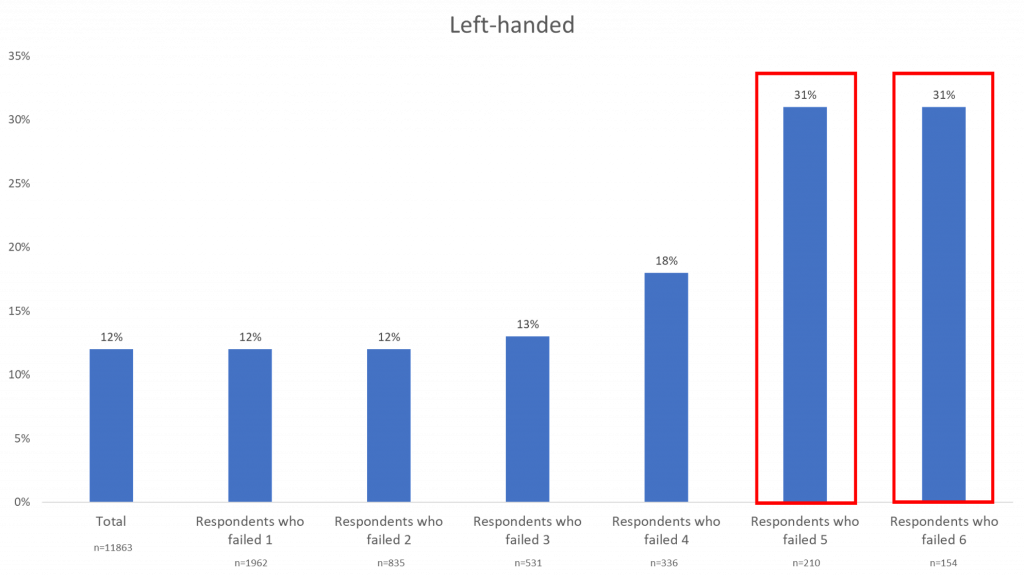
Left-Handed
The left-handed questions show the most drastic difference between the total data and the data of respondents who failed data quality checks. Of the respondents that failed 6 (and 5), 31% claimed to be left-handed, while the total only accounts for 12% of left-handed respondents. If we were to remove respondents who failed 5 or 6 of the quality checks, the total number of left-handed respondents would decrease.
Generally, there is an overestimate, even if it is slight, for each of the questions above. Overall, unreliable respondents are more likely to claim they smoke and are left-handed. Check out the other blogs in our Data Quality series:
It is clear to see the importance of analyzing your data and making sure you understand exactly what data you are presenting. By understanding this approach, you can increase your data quality and provide better recommendations to businesses that are relying on this data to make crucial decisions for the company.
To read the previous installments in our data quality series, follow these links:
An Introduction to Data Quality Checks and their Use Determining Data Quality


