
Who Really Owns the Data?
June 5, 2026
The Gap is Narrowing on ChatGPT: Consumer Familiarity of the Generative AI Market
June 15, 2026
Many consumers are feeling the economic pinch. From higher prices, inflation outpacing salary, and a more volatile job market, consumers are starting to prioritize their spending. In our most recent wave of research-on-research, we ask consumers which spending categories they expected to spend more or less on.
Let’s see what consumers are saying.
Overall
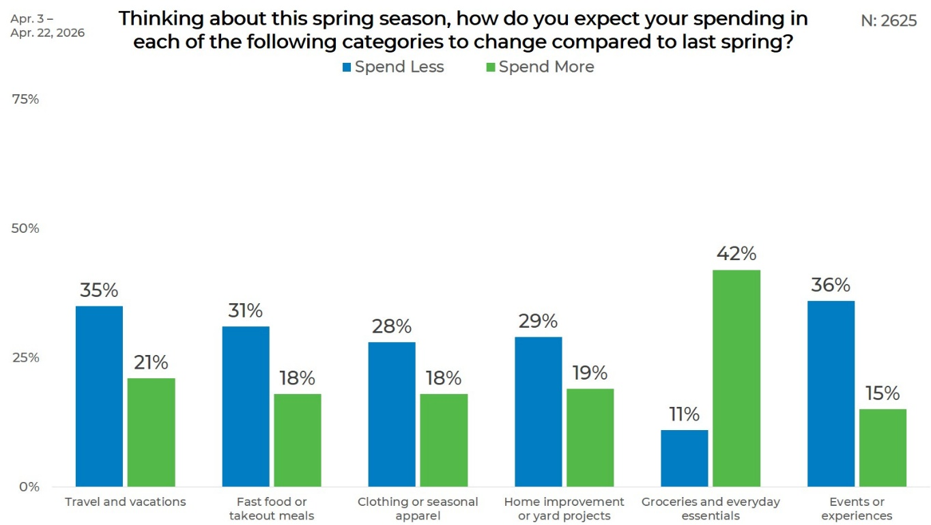
Groceries and everyday essentials move in the opposite direction. Only 11% expect to spend less, while 42% expect to spend more, making it the only category where “spend more” clearly exceeds “spend less.” For every other category, the share expecting to spend less is higher than the share expecting to spend more.
Events or experiences have the highest share expecting to spend less, at 36%, followed closely by travel and vacations at 35%. Fast food or takeout meals also show notable pullback, with 31% expecting to spend less, while home improvement or yard projects stand at 29% and clothing or seasonal apparel at 28%.
Gender
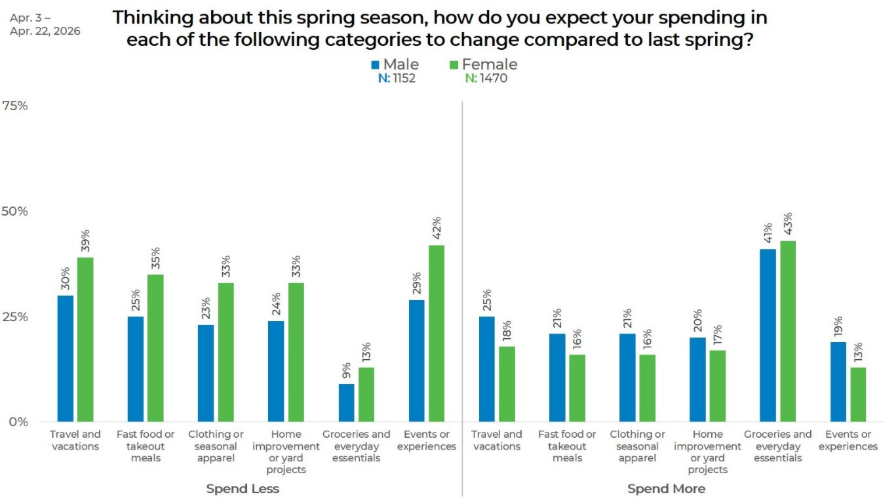
Women are more likely than men to expect to spend less across every discretionary category. The largest gap appears in events or experiences, where 42% of women expect to spend less compared with 29% of men. Women are also more likely to cut back on travel and vacations, at 39% versus 30% among men.
Men are more likely than women to expect to spend more in most categories, including travel and vacations at 25% compared with 18% among women. Groceries and everyday essentials are the exception to the broader discretionary pattern, with 43% of women and 41% of men expecting to spend more.
Age
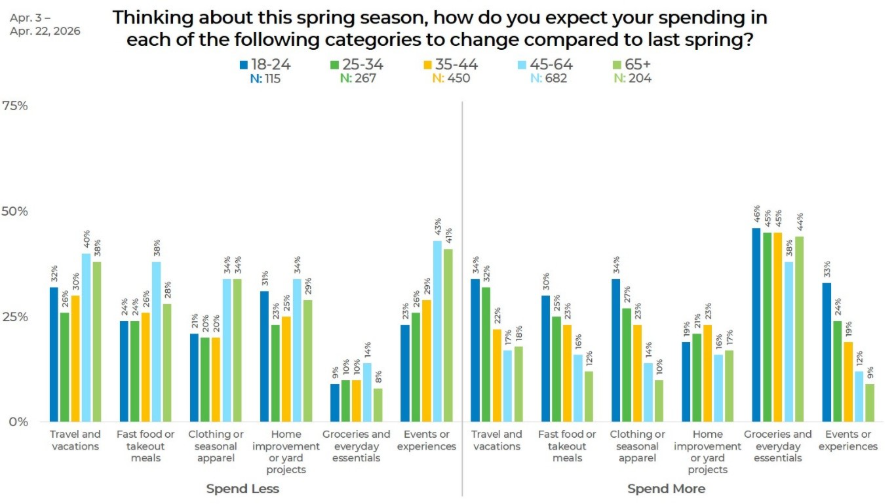
Age creates one of the clearest divides. Younger adults are more likely to expect higher spring spending in discretionary categories. Among 18- to- 24-year-olds, 34% expect to spend more on travel and vacations, 34% on clothing, and 33% on events or experiences. Among adults 65 and older, those figures drop to 18%, 10%, and 9%.
Older adults are more likely to expect cutbacks in events or experiences, with 43% of those ages 45 -to- 64 and 41% of those 65 and older expecting to spend less. Groceries and everyday essentials remain high across all ages, with “spend more” ranging from 38% among adults 45- to- 64 to 46% among those 18-to-24.
Income
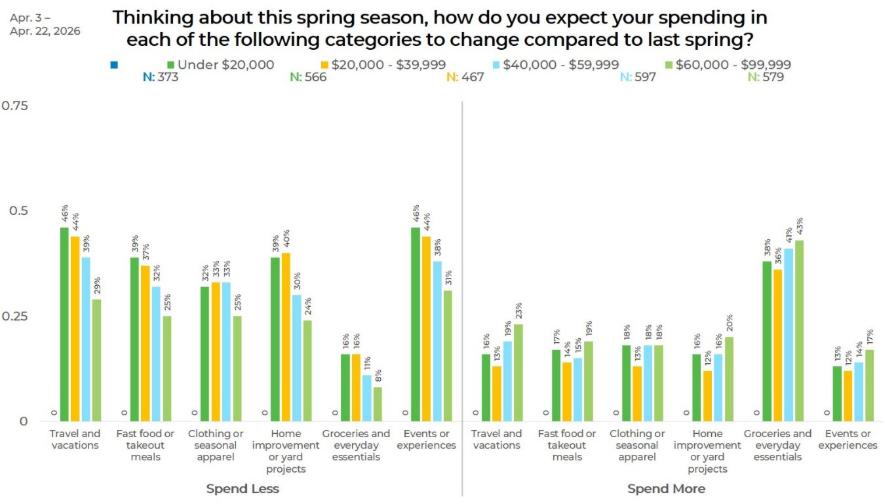
Income shows a strong spending divide. Lower-income respondents are more likely to spend less across nearly every discretionary category. For travel and vacations, 46% of those earning under $20,000 expect to spend less, compared with 24% of those earning $100,000 or more. Events or experiences follow the same pattern, at 46% versus 27%.
Higher-income respondents are more likely to expect to spend more. Among those earning $100,000 or more, 32% expect to spend more on travel, 28% on home improvement or yard projects, and 25% on fast food or takeout meals. Groceries and everyday essentials are highest in this group as well, with 50% expecting to spend more.
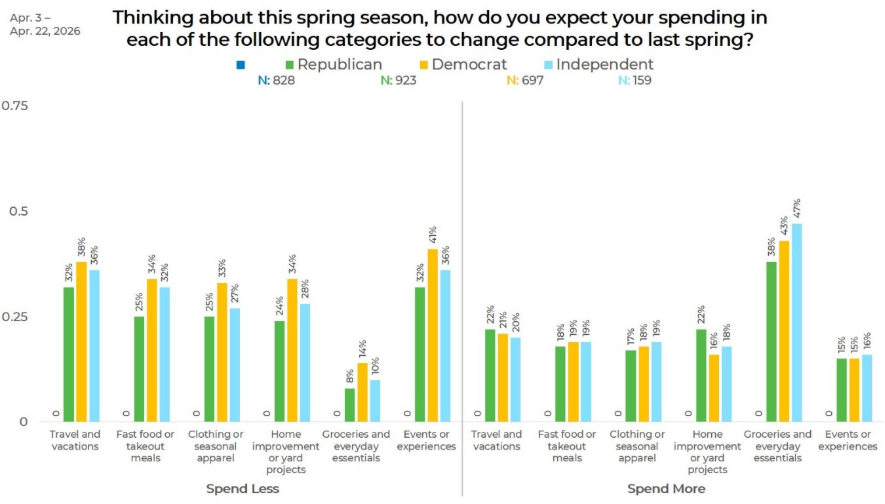
Political Affiliation
Across political groups, groceries and everyday essentials remain the strongest “spend more” category. Independents are highest at 47%, followed by Democrats at 43%, then Republicans at 38%.
Democrats report the highest levels of expected cutbacks in several categories, including events or experiences at 41%, travel and vacations at 38%, clothing at 33%, and home improvement or yard projects at 34%. Republicans are generally lower on expected spending reductions, including 24% for home improvement and 25% for fast food or takeout meals.
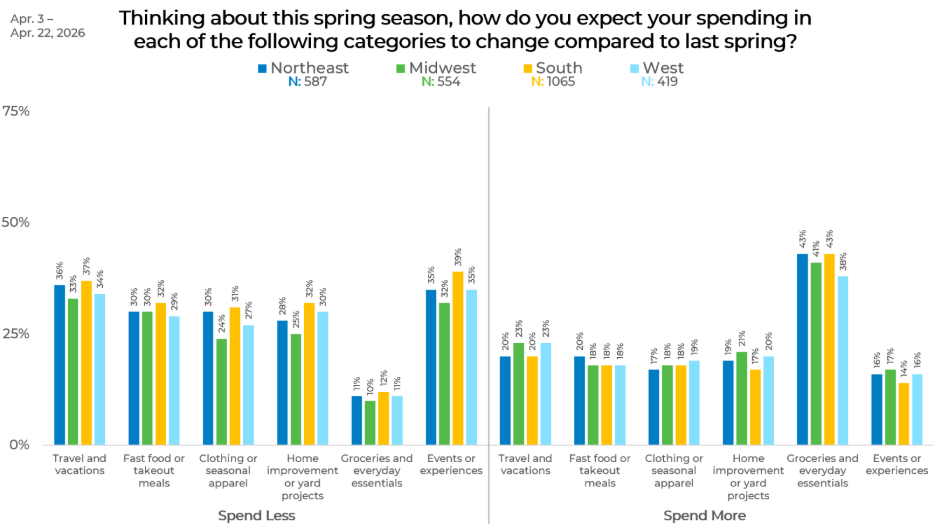
Region
Regional differences are relatively modest. For travel and vacations, expected cutbacks range from 33% in the Midwest to 37% in the South. Events or experiences show a wider spread, with 39% in the South expecting to spend less compared with 32% in the Midwest.
Groceries and everyday essentials are consistent across regions, with 41% to 43% expecting to spend more in the Northeast, Midwest, and South, and 38% in the West. No region shows more than 12% expecting to spend less on groceries and essentials.
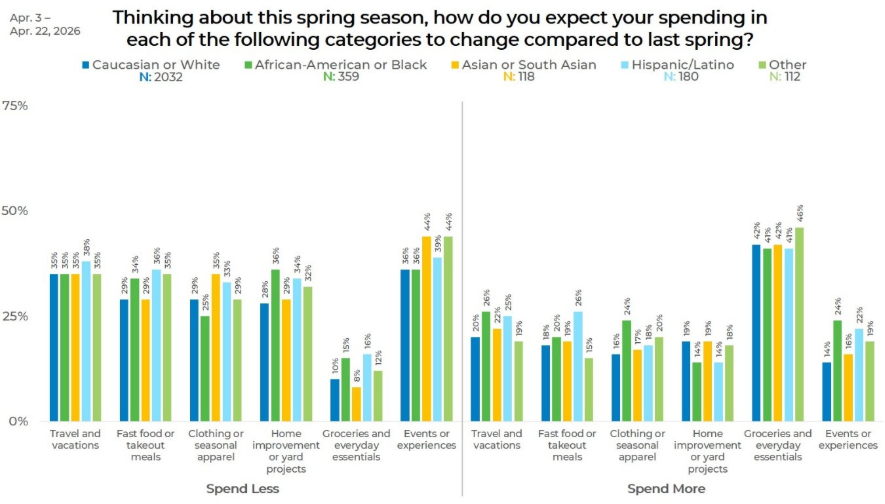
Ethnicity
Expected spending reductions are fairly similar across groups for travel and vacations, ranging from 35% to 38%. Events or experiences show more variation, with Asian respondents and Other respondents both at 44% expecting to spend less, compared with 36% among Caucasian and African –American respondents.
Hispanic respondents are more likely to expect higher spending on fast food or takeout meals, at 26%, while African American respondents are highest for clothing or seasonal apparel at 24% and events or experiences at 24%. Groceries and everyday essentials again stand apart, with 41% to 46% across all groups expecting to spend more.
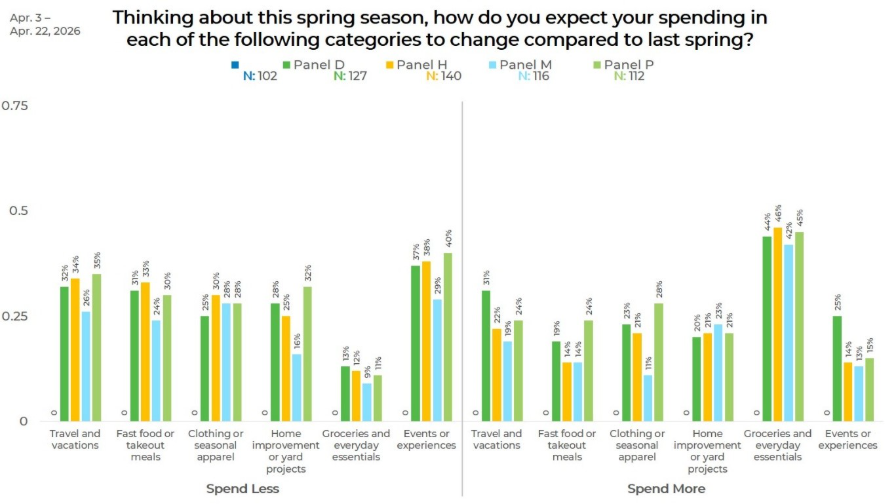
Panel
Panel results add another perspective on how spending expectations differ across respondent sources. Panel U shows the highest expected cutbacks in several categories, including 44% for travel and vacations, 42% for fast food or takeout meals, 41% for home improvement or yard projects, and 48% for events or experiences. Panel M is lower on several spending-reduction measures, including 26% for travel and 16% for home improvement.
Groceries and everyday essentials remain the leading “spend more” category across every panel, ranging from 40% in Panel U to 46% in Panel H. Panel D stands out for higher expected spending on travel and vacations at 31% and events or experiences at 25%, while Panel P is highest for clothing or seasonal apparel at 28%.
Find out how EMI can help you on your next study, click the button below to request a free consultation.


