
When It Comes To Data Quality – Not All Panels Are Equal
July 17, 2020
Intellicast S3E36: GRIT Report and a Publix Update
July 22, 2020
In this installment of our data quality blog series, we will be exploring how data quality is impacted by demographic differences. In our previous installments, we’ve examined data quality by panel and explained the different quality checks we use to measure data quality.
Demographics of a “Fraudulent Profile”
When looking at the demographic differences in data quality, it is important to analyze what data we are removing. By doing this, we can profile respondents who are most likely to provide inaccurate/false data.
For example, of the respondents who failed 6 data quality checks, 62% of them were male, 77% were between the ages of 18 and 44, 51% claimed to work full time, and 51% were Caucasian.
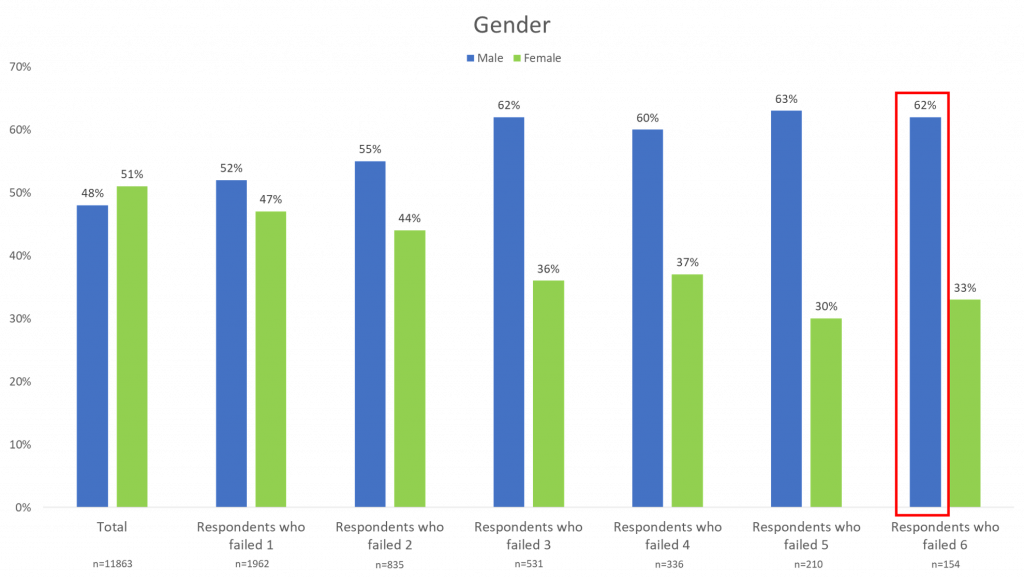
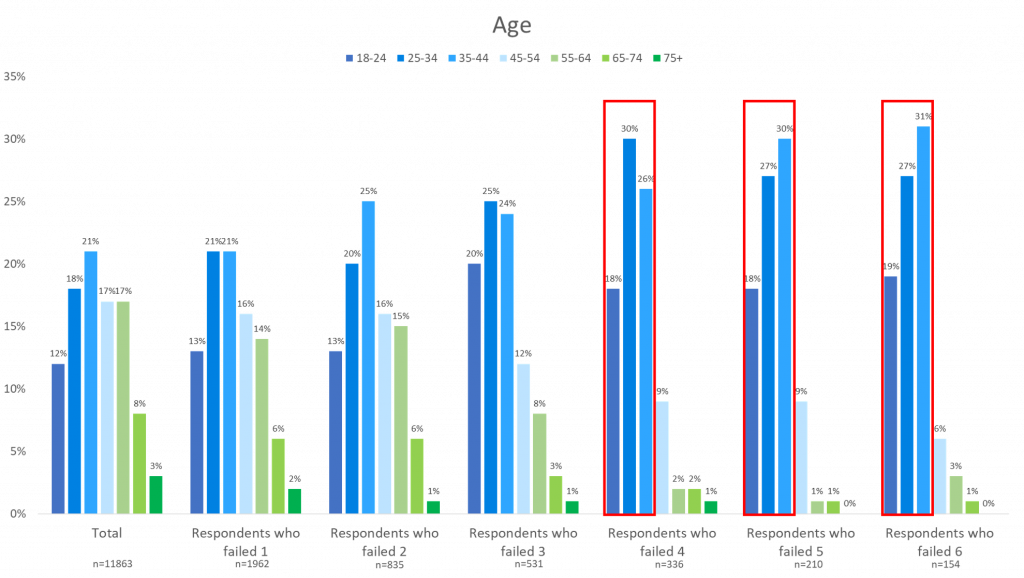
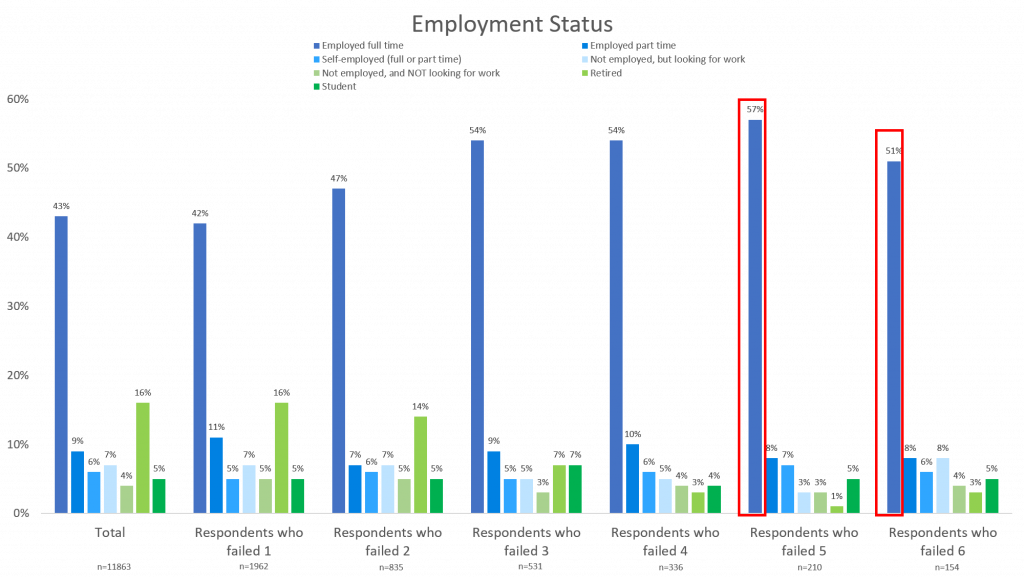
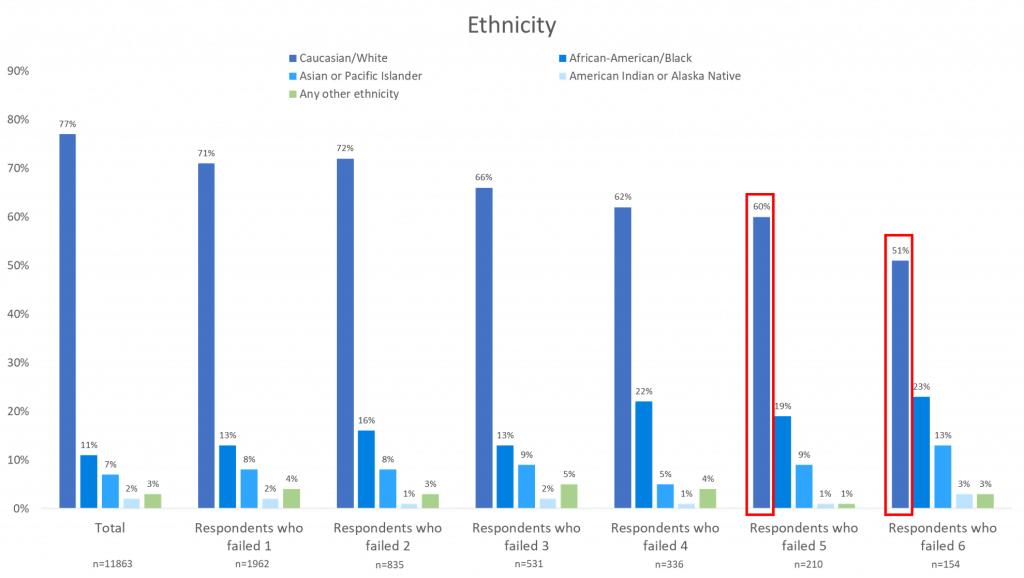
These traits are most likely to be the traits of a respondent who is providing unreliable survey answers. However, this does not mean that every respondent that fits these traits is bad, or that everyone that does not fit these traits is good.
How does this information help?
This information is particularly useful when deciding whether to remove a suspicious respondent or not based on other failed quality checks. If a respondent was already causing some suspicion, looking at their demographics and comparing them to the “fraudulent profile” might help to sway the decision on whether to remove them from the data or not. If the respondent in question fits most or all these traits– Caucasian, male, younger, full-time job– we might be more inclined to remove them because they are more likely to be an unreliable respondent.
It is important to note that we never want to search for or single out everyone that fits a “fraudulent profile,” but knowing the demographic traits of respondents that are most likely to be unreliable helps us to make a decision about respondents that are already cause for suspicion.
Having this demographic information available will help you to profile exactly who is providing unreliable data, and in turn, make an informed decision to remove them from the data if needed. Paired with the 19 other quality checks from our previous blog, we are now able to consider a multitude of qualifications before we make the best decision for the survey.
To read the previous installments in our data quality series, follow these links:
An Introduction to Data Quality Checks and Their Use Determining Data Quality


