
Intellicast S3E35 – Andrew Moffatt of OpinionRoute
July 14, 2020
Data Quality – Demographic Differences
July 22, 2020
In this installment of our data quality blog series, we look at data quality by panel provider. In our first installment, we explained the different quality checks we use to measure data quality.
Failing Quality Checks – What’s Good vs. Bad
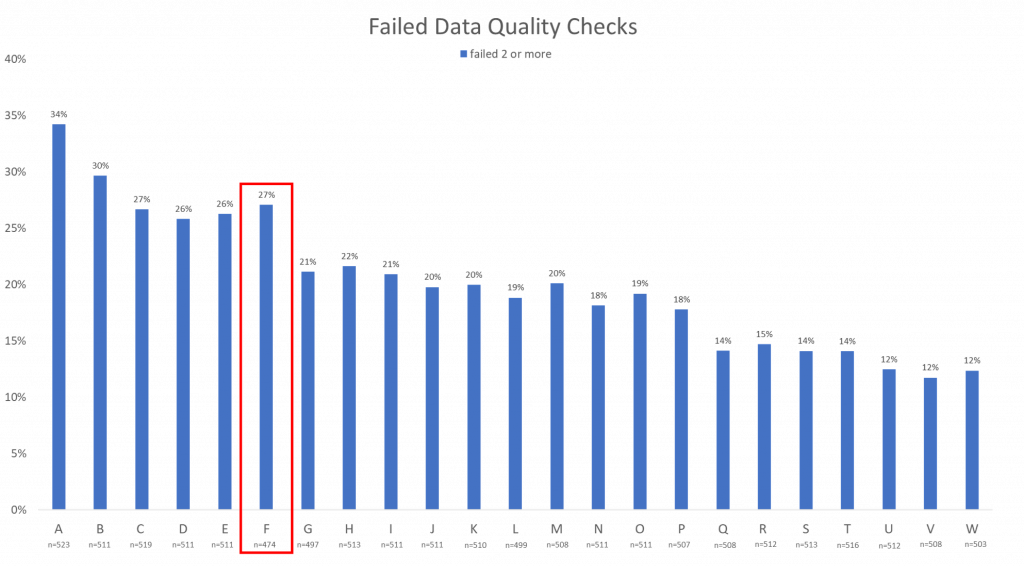
You will notice that some panels fail significantly more data quality checks than others. One panel might have a high percentage of respondents that failed one or more quality checks and a low percentage of respondents that failed 6 or more quality checks and vice versa.

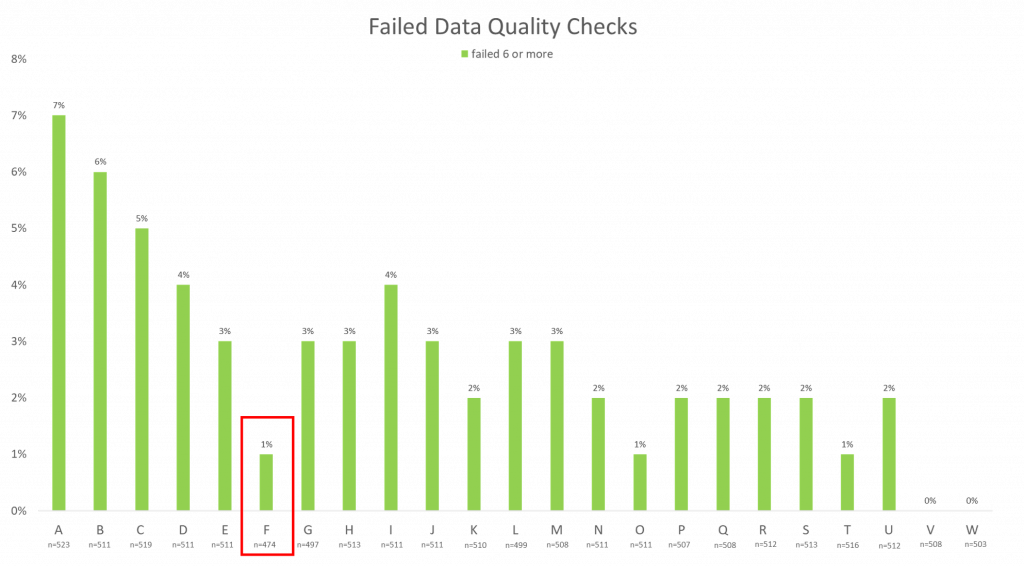
For example, in these next three graphs, pay special attention to Panel F. Panel F is a prime example of a panel that may look like an unreliable source for data because 27% of its respondents failed 2 or more data quality checks. However, because the percent of respondents that failed 6 or more data quality checks is so low, it is actually one of the more trustworthy panels.
Does this mean that one panel is always more reliable or accurate than another? Not necessarily. It is important to consider other factors, including the steps already taken by the panels to remove bad data. Many panels have data quality checks of their own that they perform before their data is presented.
Suspicious or Bad Responses
There are also different levels of bad or suspicious responses. For instance, a respondent might fail a quality check because they accidentally hit the wrong button, misread a question, took longer to complete the survey (possibly because they left the page and came back to finish the survey later, etc.), but that doesn’t mean that the respondent should be removed entirely.
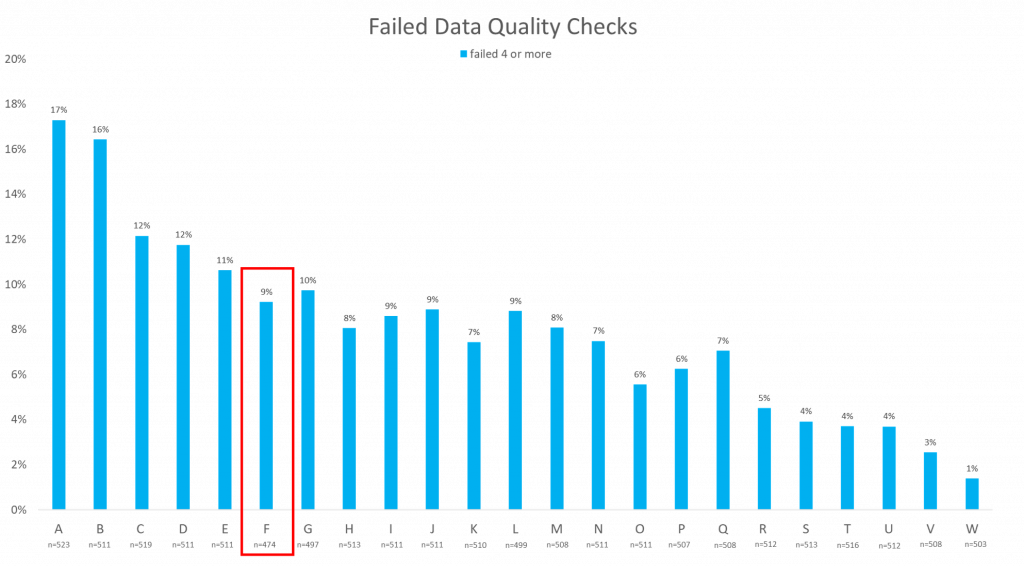
That’s why it is important to recognize the percentage of respondents that only failed one quality check versus the percentage of respondents that failed 4, 6, or even 8 quality checks. The higher the number of failed quality checks, the less reliable the data becomes. The decision comes when you must decide how much bad data is too much. Should the respondent be removed after they fail 4 quality checks? After 8? Where is the line between mistakes and fraudulent data?
Because these questions can’t be answered by simply taking the data at face value, we must consider all factors that play into what makes the data reliable or not.
Once you consider the size of the panel, the history of the panel, and the data quality in each panel, then you can determine whether a panel is a source of reliable data or not. This helps us keep track of our panels and understand where our data is coming from.
To learn more about EMI’s commitment to quality, click the button below to request a free consultation.


