How Price Hikes Are Shaping Streaming Service Choices
October 10, 2024Top Voter Priorities: Economy vs. Social Issues in the Upcoming Election
October 31, 2024How Much Time Do People Really Spend on Screens?
In today’s digital world, screens have become an integral part of our daily lives. Whether it’s working on a computer, browsing on a smartphone, or relaxing in front of the TV, screen time is ever-present. But how much time do people really spend in front of screens? This blog explores the distribution of daily screen time across various demographics, highlighting key trends in usage patterns.
General
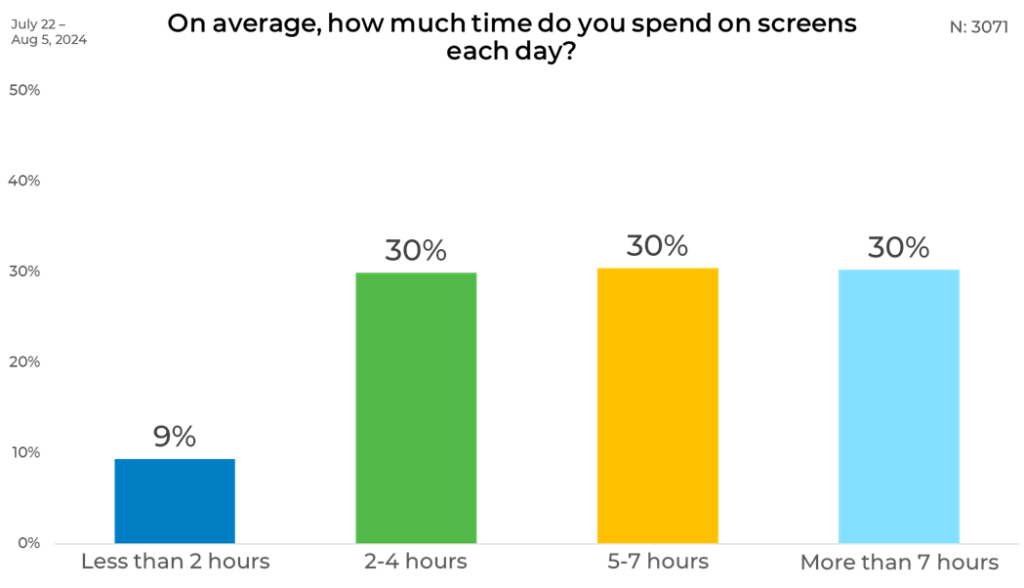
Daily screen time shows a strong leaning toward high usage, with 90% of respondents reporting at least 2 hours of screen time each day. A notable 60% spend 5 or more hours on screens, evenly split between 30% logging 5-7 hours and 30% exceeding 7 hours per day. Only 9% manage to keep their screen time under 2 hours. This data suggests that for most people, screens are a significant part of their day.
Gender
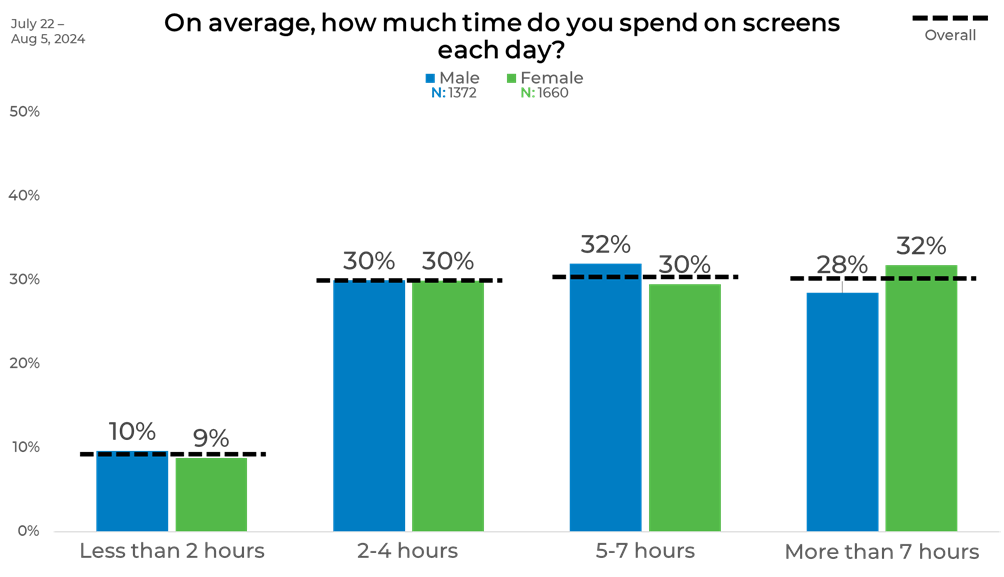
Gender differences in screen time are minimal. Around 30% of both men and women report spending 2-4 hours on screens daily, while a similar share—32% of men and 30% of women—spend 5-7 hours. Interestingly, women are slightly more likely to spend over 7 hours on screens (32%) compared to men (28%). Overall, heavy screen usage is common for both genders.
Political Affiliation
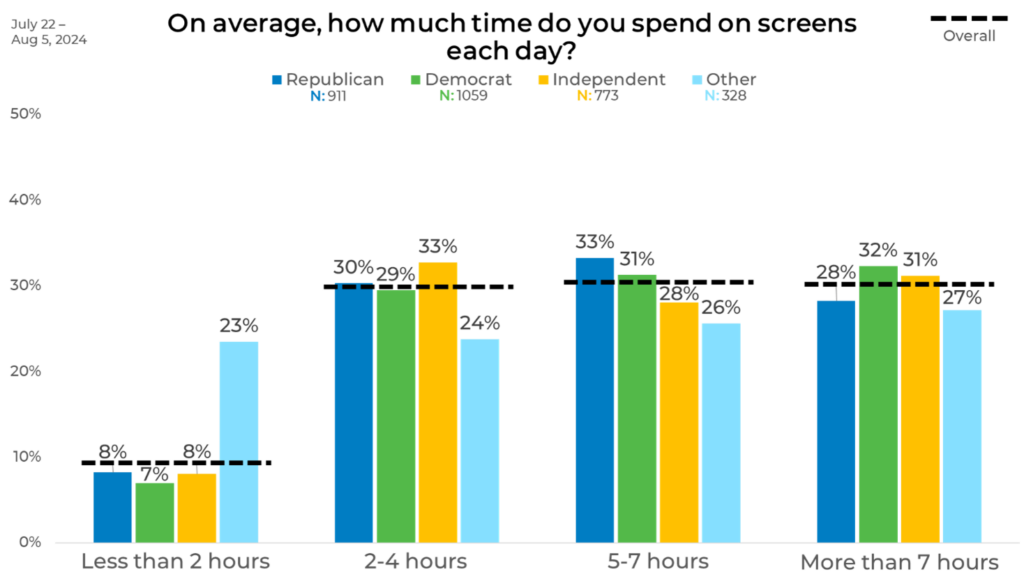
When looking at political affiliation, Republicans, Democrats, and Independents show similar screen time habits. Roughly 30% of each group spends 5-7 hours daily, with 28-32% exceeding 7 hours. Although there are small variations, screen time remains consistent across political groups, showing that digital consumption transcends political lines.
Age
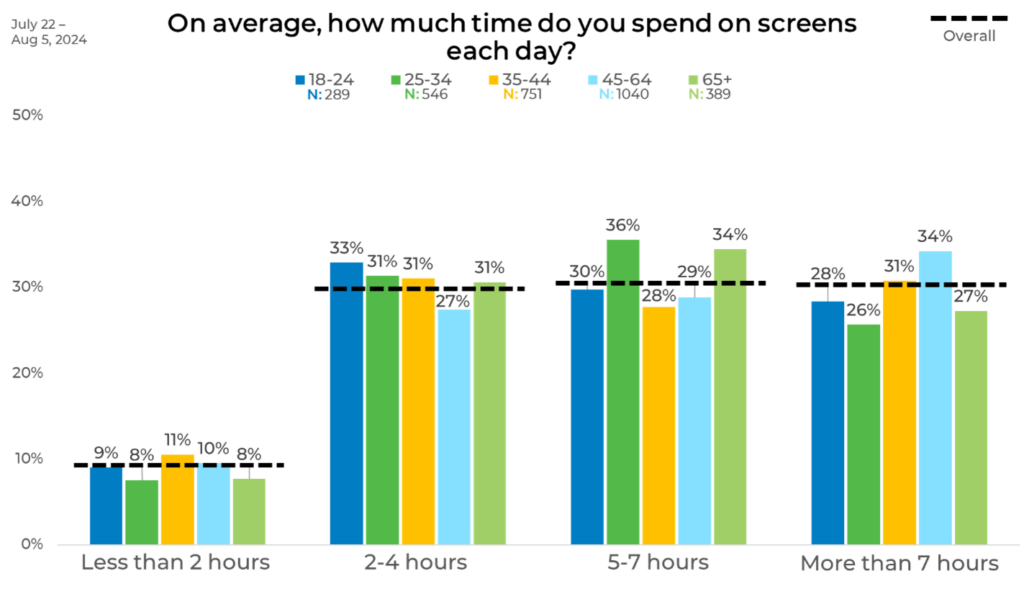
Screen time trends also vary by age group. Younger adults (18-24 and 25-34) have a more even spread across usage categories, with around 28-30% spending over 7 hours on screens daily. Adults aged 45-64 are the most likely to exceed 7 hours (34%), while those aged 65+ also show significant screen engagement, with 34% reporting 5-7 hours of use daily. Across all ages, fewer than 11% of respondents keep screen time under 2 hours, underscoring the widespread reliance on digital devices.
Ethnicity
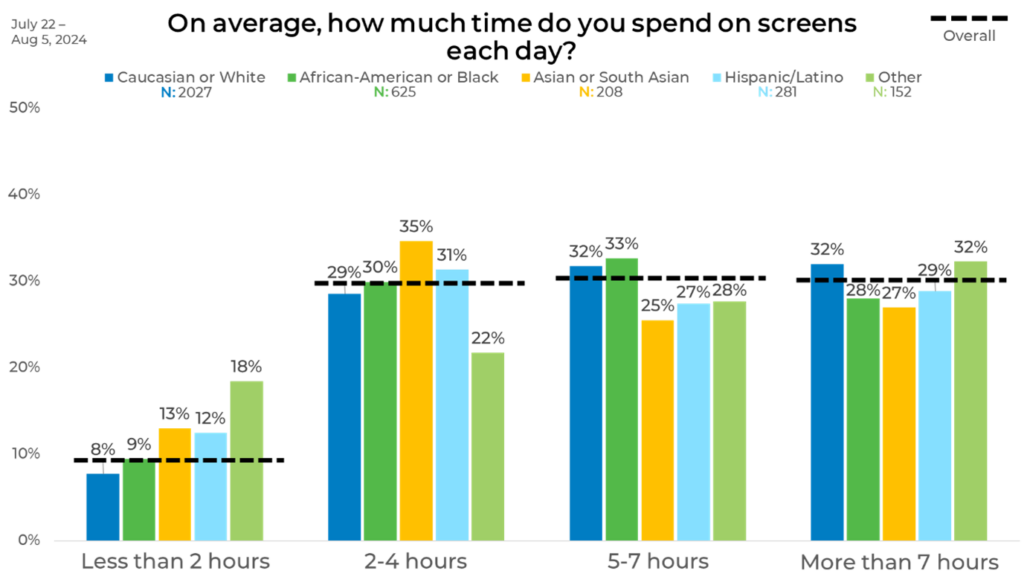
Ethnic groups show some variation in screen time. Caucasian and African-American respondents are the most likely to report extensive screen use, with 32% and 28%, respectively, spending over 7 hours daily. Hispanic/Latino respondents are evenly spread across all screen time categories, while Asian and South Asian respondents tend to fall into the moderate 2-4 hour range (35%). Overall, the data shows that most ethnic groups engage in heavy screen usage, with slight differences in time distribution.
Panels
aily screen time varies significantly across respondent panels. Panel K leads with the highest percentage (41%) spending more than 7 hours on screens, while Panel B has the lowest in this category (23%). Interestingly, Panel B shows the highest proportion (38%) of respondents spending 2-4 hours daily, whereas Panel M leans more toward heavy usage, with 38% spending 5-7 hours and 32% exceeding 7 hours. Panels C and G present a more balanced distribution, with a slight lean toward the 5-7 hour range in Panel C.
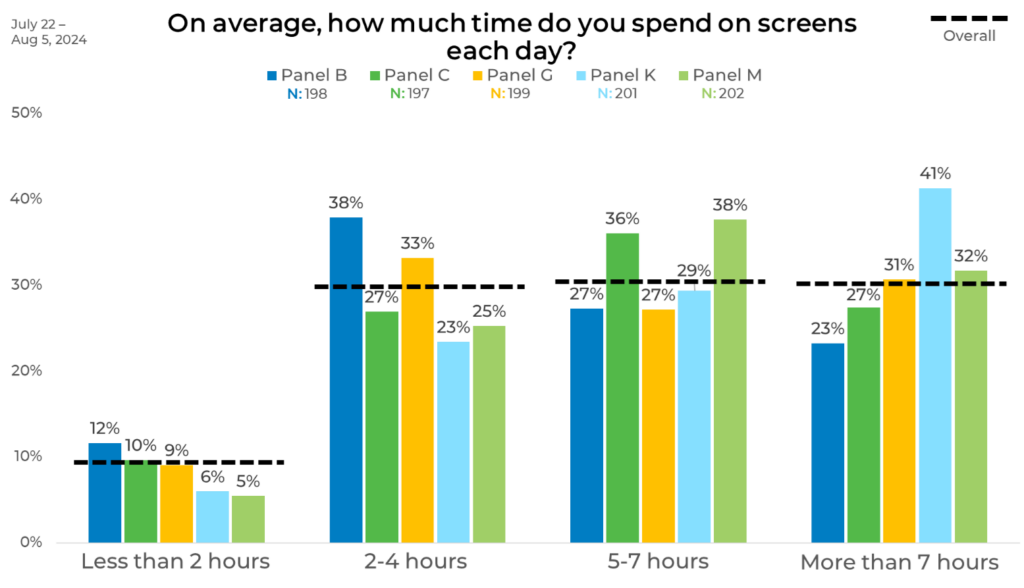
This is an excellent representation of where quality data sampling matters. At EMI, we prioritize strategically blending sample sources to balance demographics as well as behaviors and attitudes to ensure that we provide the most representative and accurate data. Download The Sample Landscape: 2024 Edition to better understand how panels differ from one another and how they impact your data.


