Inside the Voter Mindset: Key Motivations Behind 2024 Presidential Choices
September 5, 2024
Respondent Engagement, Rebrands, And New AI Legislation
September 13, 2024The U.S. Economy: More People Displeased Than Pleased
When it comes to the U.S. economy, Americans are showing clear signs of dissatisfaction. Our latest data highlights just how divided people feel, with a much larger proportion expressing negativity over positivity. Let’s dive into the breakdown of this economic sentiment across different groups.
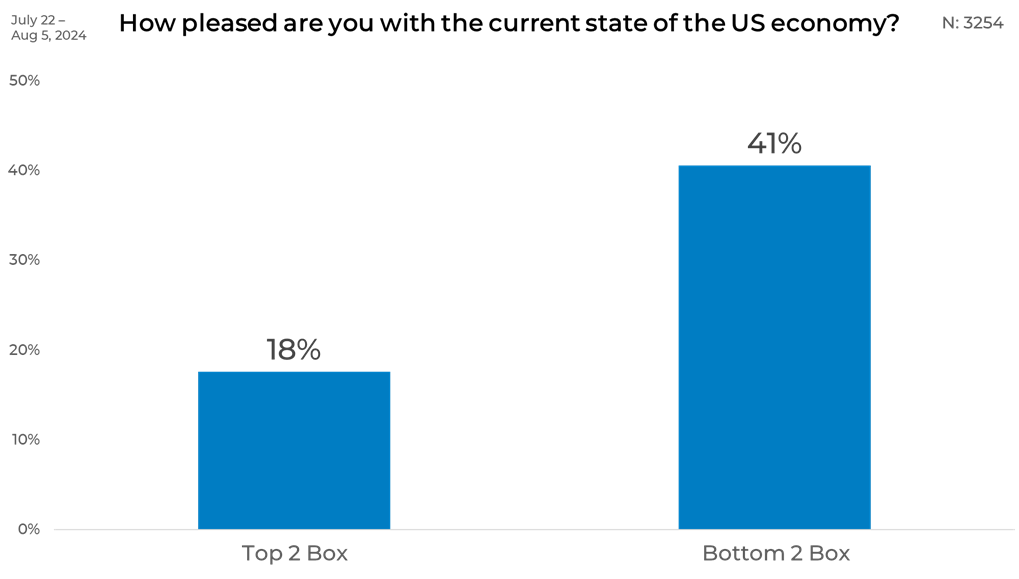
Respondents were asked to rate their satisfaction with the current state of the US economy on a scale of 6—Top two boxes are “Extremely pleased” and “very pleased,” bottom two boxes are “extremely displeased” and “very displeased,” and middle two boxes are “somewhat pleased” and “somewhat displeased.”
General
When asked about their satisfaction with the U.S. economy, only 18% of respondents expressed a high level of contentment (Top 2), while a significant 41% reported being deeply dissatisfied (Bottom 2). This reveals a considerable gap, with more than twice as many people feeling negative about the economy compared to those who are pleased.

Gender
Among males, 22% are satisfied with the U.S. economy, while only 14% of females share that view. On the dissatisfaction side, 46% of females express deep dissatisfaction, compared to 33% of males. This reveals that women are significantly more dissatisfied with the current state of the economy than men.

Political Affiliation
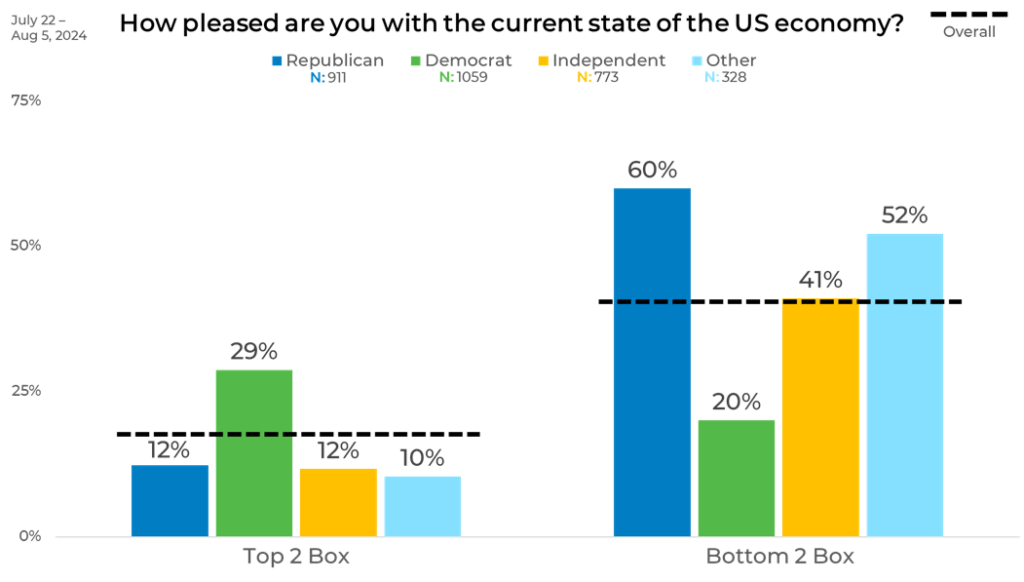
Democrats are the most satisfied, with 29% rating the economy positively, while only 12% of Republicans and Independents feel the same. Republicans show the highest dissatisfaction, with 60% in the Bottom 2, compared to just 20% of Democrats. Independents also lean heavily negative, with 41% expressing deep dissatisfaction.

Age
The electorate appears divided with no clear frontrunner. Recent data shows that 36% of voters are leaning toward Donald Trump, while 33% support the Democratic nominee. A significant portion remains uncertain, with 14% undecided, 9% rejecting all options, and 8% considering alternative candidates. These figures highlight the fluidity and potential unpredictability of the upcoming election.

Income
The income breakdown shows a slight variation in satisfaction with the U.S. economy across income levels. Those earning $100,000 or more are the most positive, with 21% in the Top 2, while those making $40,000–$59,999 are the least satisfied at just 14%. Dissatisfaction is highest among those earning $40,000–$99,999, with 44% in the Bottom 2, while the lowest level of dissatisfaction comes from those earning $100,000+ (34%). Interestingly, both the lowest and highest income groups show similar dissatisfaction levels, around 38-39%.

Panels
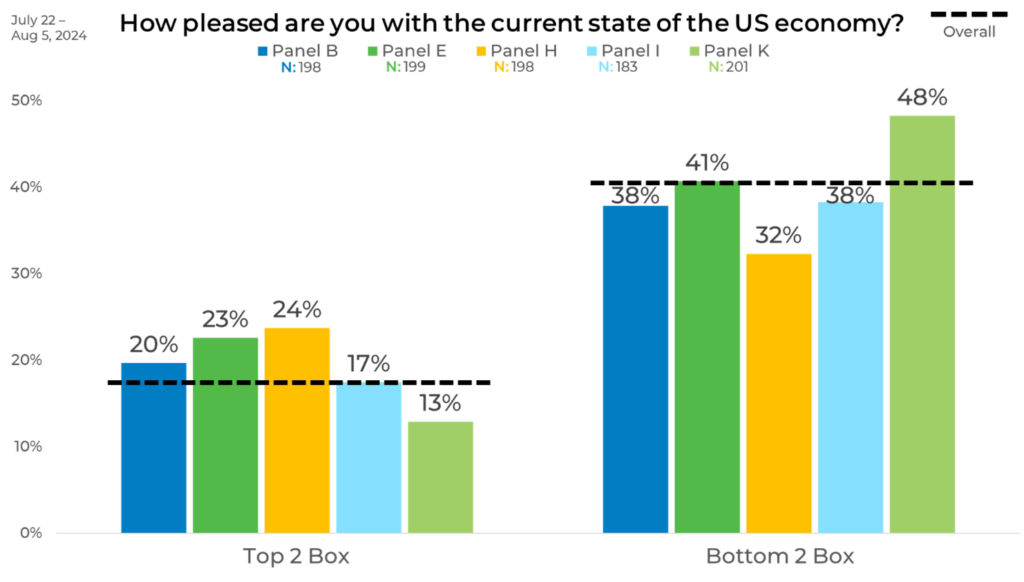
The panel breakdown reveals differing levels of satisfaction with the economy. Panel E and H have the highest satisfaction rates, with 23% and 24% in the Top 2, while Panel K reports the lowest satisfaction at just 13%. Panel K also shows the highest level of dissatisfaction, with 48% in the Bottom 2, followed by Panel E at 41%. Panel H stands out with relatively lower dissatisfaction at 32%. This shows that economic perceptions vary significantly across panels, with Panel K being the most negative overall.

This is an excellent representation of where quality data sampling matters. At EMI, we prioritize strategically blending sample sources to balance demographics as well as behaviors and attitudes to ensure that we provide the most representative and accurate data. Download The Sample Landscape: 2024 Edition to better understand how panels differ from one another and how they impact your data.


