
New Year, New Predictions for MRX: Our 2024 Predictions for the Industry
January 19, 2024
Twitter or X – What’s In A Name?
January 25, 2024
Election season is upon us. The Iowa caucuses have wrapped up, and the New Hampshire primary is tomorrow. As we take the first steps in the race to the White House, we want to know if people would vote and who they are likely to vote for at this early stage. We explored this in our most recent wave of research-on-research.
Likelihood To Vote
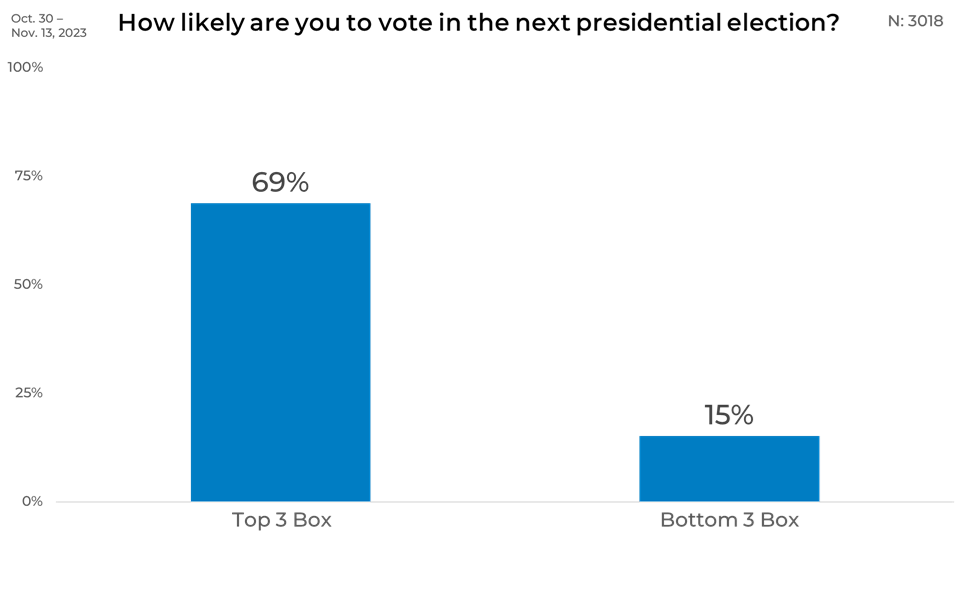
First, let’s look at the likelihood of voting in the 2024 election. When asked if they would vote, a significant 69% of respondents indicated they are highly likely to vote, falling into the ‘Top 3 Box’ of voter likelihood. On the other side of the spectrum, a smaller yet notable percent of respondents, 15%, is categorized within the ‘Bottom 3 Box’, signaling a lower likelihood of voting.
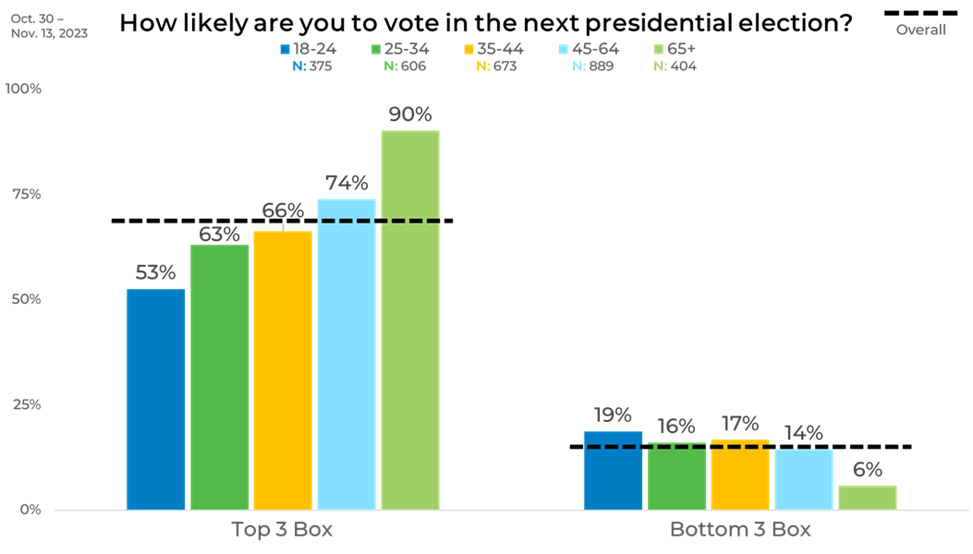
Age
Breaking the results down by age, we found that the youngest cohort, aged 18-24, shows a relatively modest intention to vote, with 53% falling into the ‘Top 3 Box’ of likelihood. As age increases, so does the likelihood of voting, with 63% of those 25-34 years old, 66% of 35-44, 74% of 45-64, and a significant 90% of those aged 65 and above indicating they are likely to vote.
In contrast, the ‘Bottom 3 Box’ demonstrates the lowest inclination to vote among the youngest voters at 19%, decreasing progressively with age to 16% for the 25-34 age group, 17% for 35-44, and 14% for 45-64.
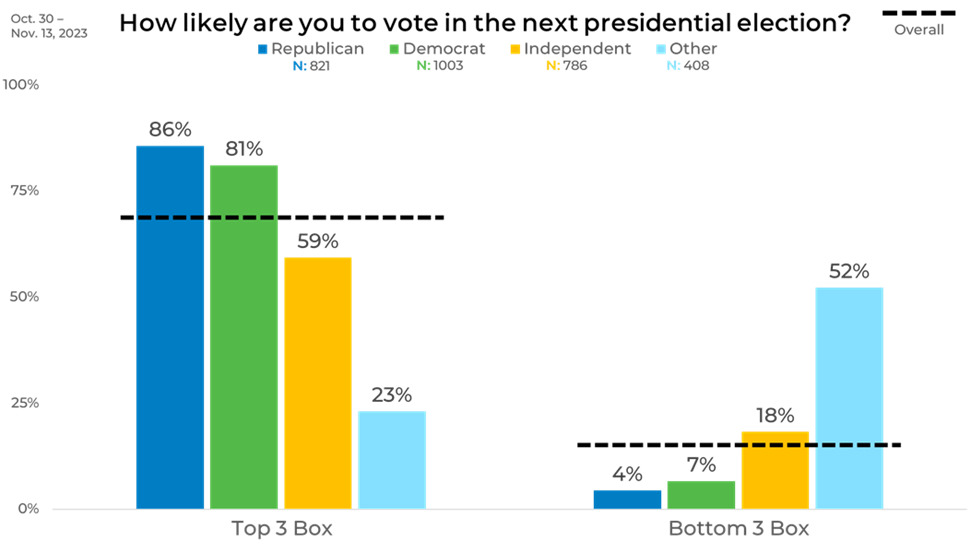
Political Affiliation
Looking at the results by political affiliation, we see a high voter intent for both major parties. An impressive 86% of self-identified Republicans are likely to vote, as represented in the ‘Top 3 Box’. Democrats are not far behind, with 81% indicating a similar propensity for electoral participation. Independents, however, show a comparatively lower intent, with 59% falling into the same category.
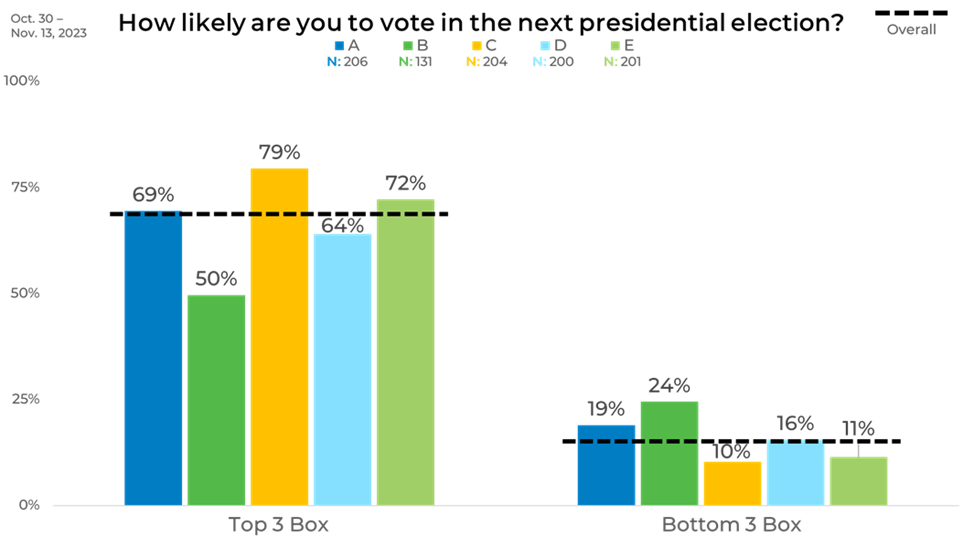
Panel
Breaking down the results by panel highlights the differences you can get based on the panel you use. The disparity between Panels B and C is particularly striking. Panel C exhibits the highest likelihood of voting, with 79% of respondents in the ‘Top 3 Box’, signaling robust voter engagement. In contrast, Panel B reveals a substantially lower intent to vote at just 50%, marking a notable 29% difference from Panel C. This is the most significant gap among all the panels surveyed, indicating how voter turnout projections can dramatically differ depending on the panel chosen for the study.
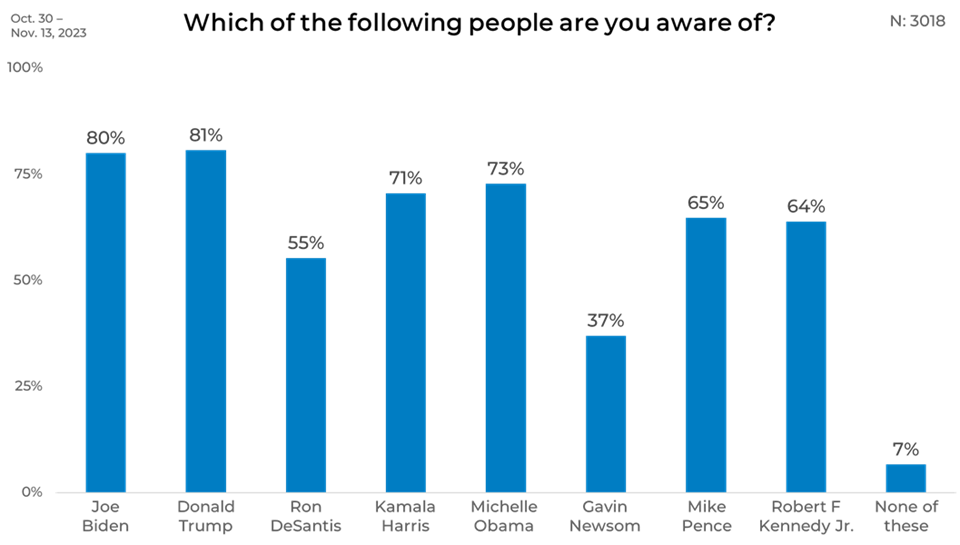
Candidate Awareness
Next, we asked respondents about their awareness of various candidates and potential candidates. Donald Trump and Joe Biden emerged as the most recognized figures, with 81% and 80% of respondents aware of them.
While the spotlight on Trump and Biden is strong, other political figures also register significantly in public consciousness. Kamala Harris, the Vice President, is known to 71% of those surveyed, and Michelle Obama, the former First Lady, to 73%. Conversely, Gavin Newsom, the Governor of California, is recognized by 37%. A small yet noticeable segment of the population, 7%, does not recognize any of the listed figures, pointing to a group less engaged with political personas.
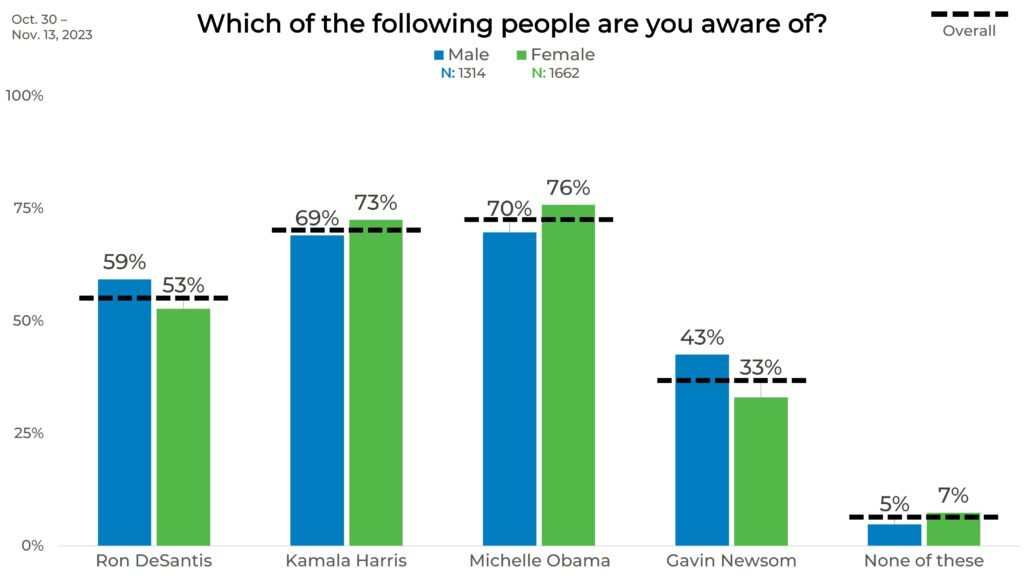
Gender
Ron DeSantis, Kamala Harris, Michelle Obama, and Gavin Newsom all show varying levels of public awareness between male and female respondents. Men are more familiar with DeSantis at 59%, while women show a slightly lower awareness at 53%. In contrast, female respondents recognize Kamala Harris and Michelle Obama more than males, with awareness levels at 73% and 76%, respectively, compared to 69% and 70% of their male counterparts. Newsom’s recognizability is higher among men (43%) than women (33%).
Interestingly, there’s a gender difference in the lack of recognition as well; 7% of women are unfamiliar with any listed political figures, a slight increase from the 5% of men.
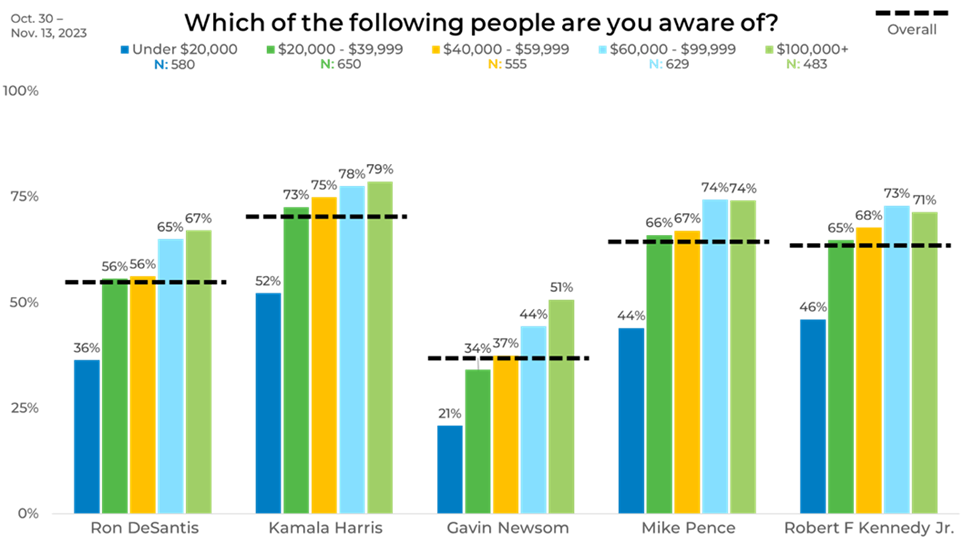
Income
The awareness of various political figures is impacted by income level. For Ron DeSantis, only 36% of those earning under $20,000 are aware of him, with this figure steadily climbing through each income bracket, reaching 67% among those earning $100,000 or more. Kamala Harris sees a similar pattern, starting with a 52% recognition rate among the lowest income bracket and rising to 79% in the highest. The trend continues with Gavin Newsom, who has a 21% awareness rate at the lowest income level and a 51% rate at the highest income level. Mike Pence and Robert F. Kennedy Jr. both have higher recognizability in the upper-income brackets, with both figures being recognized by 74% of those earning between $60,000 and $99,999, and Pence maintaining the same percentage into the $100,000+ bracket. In comparison, Kennedy sees a slight dip to 71%. These trends suggest that higher income levels may be associated with greater exposure to or interest in political figures.
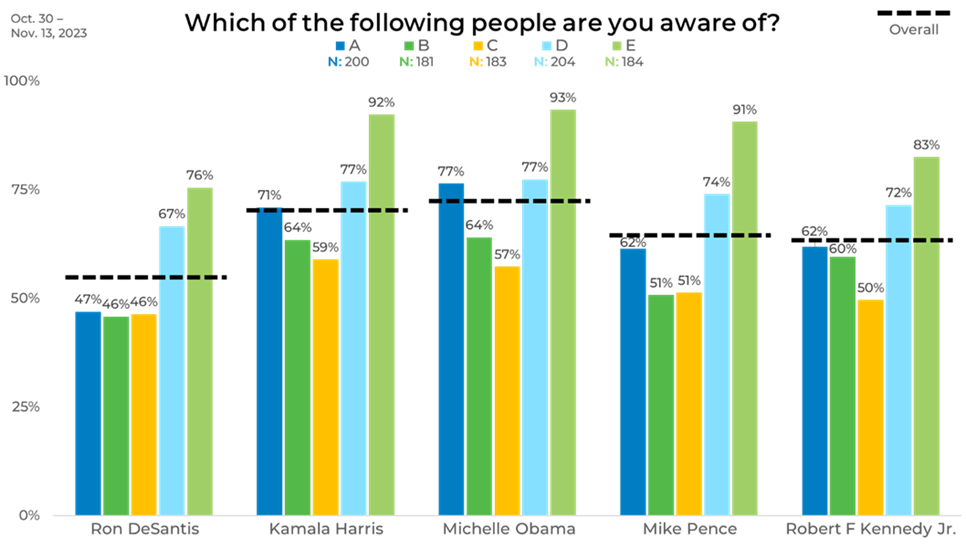
Panel
Panel composition dramatically influences the awareness of political figures. Kamala Harris and Michelle Obama see the most significant recognition gap; Harris ranges from 59% in Panel C to a striking 92% in Panel E, while Obama’s recognizability spans from 57% in Panel C to 93% in Panel E, both showing a 33-36% difference. Ron DeSantis’ awareness also varies widely, with a 29% increase from Panels A and C to Panel E. Mike Pence and Robert F. Kennedy Jr. experience a substantial rise in recognizability in Panel E, at 91% and 83%, compared to just over 50% in Panel C. These differences highlight how demographic and socioeconomic factors within panels can significantly affect the data when conducting polling.
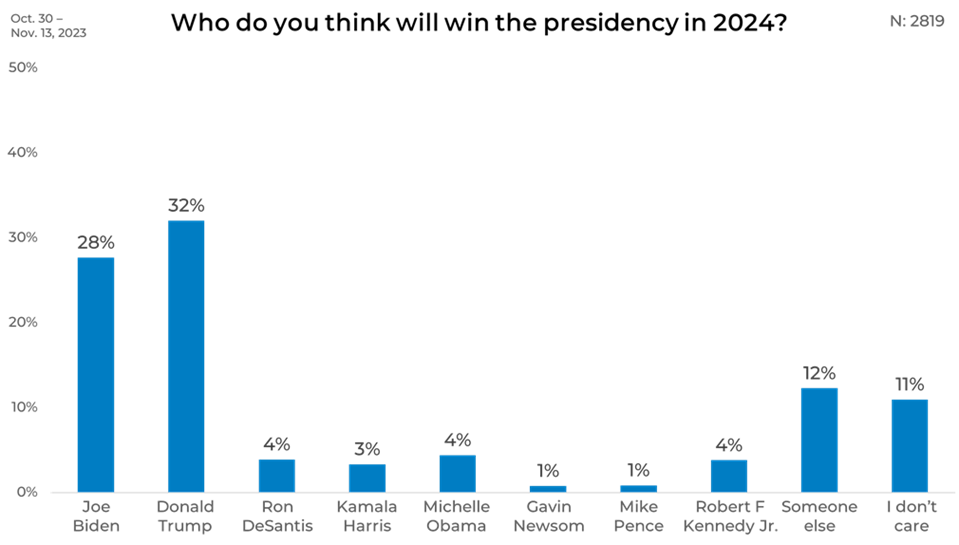
Win 2024 Election
Finally, we asked respondents who they think will win the 2024 presidential election. Their responses were notably divided. Donald Trump emerged as the front-runner, with 32% of those surveyed predicting he would win. Close behind is the prospect of ‘Someone else’ clinching the presidency, a viewpoint held by 29% of respondents, reflecting a significant portion of the public open to alternatives outside the leading two candidates. Joe Biden was predicted to win by 28% of participants, placing him just slightly behind public expectations.
Interestingly, a notable 11% of the population expresses indifference, stating ‘I don’t care’ about the outcome. This detachment could signal a variety of sentiments, from political fatigue to a belief that the presidency might have a limited impact on their daily lives. These results demonstrate not just the competitive nature of the race but also an undercurrent of uncertainty or apathy toward the upcoming election.
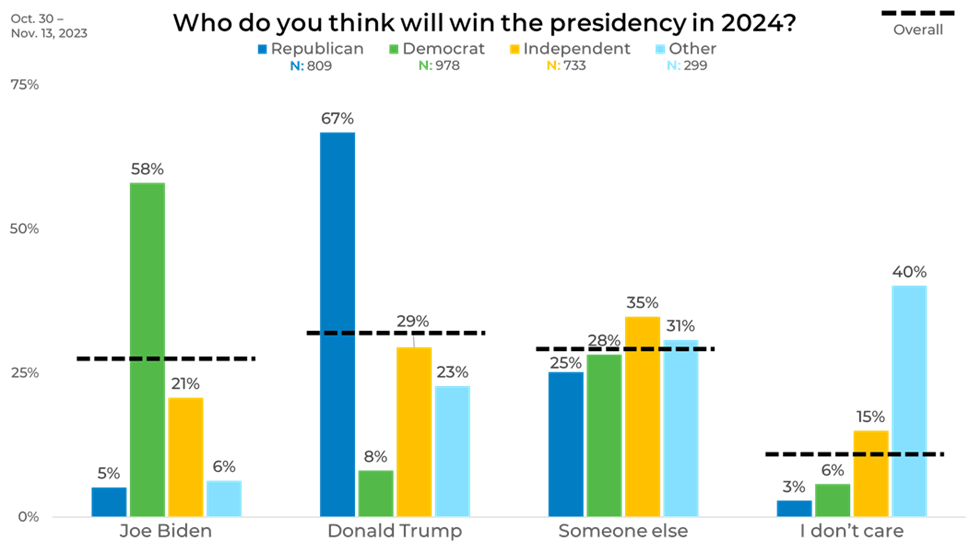
Political Affiliation
Strong partisan support exists when asking who will win the 2024 presidential election. A vast majority of Republicans, 67%, foresee a Donald Trump win, whereas Democrats rally behind Joe Biden, with 58% expecting his victory. In contrast, only a tiny fraction of Republicans and Democrats see the opposing party’s candidate as the likely winner – 5% for Biden among Republicans and 8% for Trump among Democrats.
Independent and other political group affiliates exhibit less certainty towards the leading party candidates, with 35% and 31% betting on ‘Someone else’ taking the White House. Disinterest in the election outcome peaks among the ‘Other’ category, where 40% state ‘I don’t care,’ a sentiment significantly less common among Republicans and Democrats. This reflects a political landscape divided by partisan lines and varying levels of engagement and openness to non-traditional candidates.
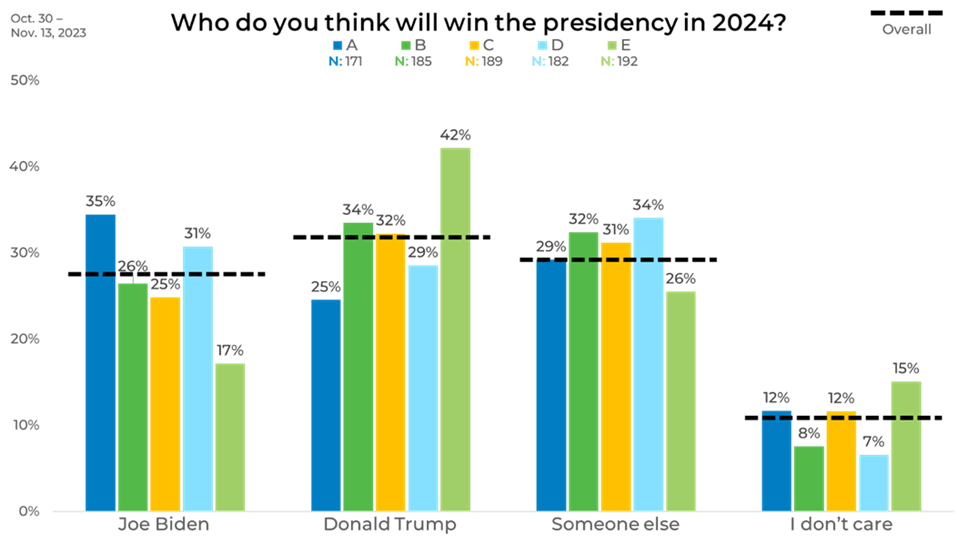
Panel
The anticipated winner of the 2024 presidential election varies across different panels identified as A through E. Panel A exhibits the highest confidence in Joe Biden at 35%, while Panel E is the least optimistic about his chances, at just 17%. Donald Trump’s strongest predicted win comes from Panel E, where 42% foresee his victory, contrasting with Panel A, where only 25% hold this view. The option of ‘Someone else’ winning is fairly evenly seen across Panels B, C, and D, hovering around the 31-34% mark.
The proportion of respondents who express indifference, stating ‘I don’t care,’ ranges from 7% to 15%, with Panel E showing the highest level of disengagement. This variance illustrates polling results can vary significantly.
As you can see, intent and awareness can vary significantly across demographics and by panel, impacting your data. That is why strategically blending sample is the best practice to ensure you are accounting for distributed demographic and attitudinal and behavioral balance.
Learn more about strategic sample blending by downloading our whitepaper, Strategic Sample Blending: The Premier Sampling Methodology for Tracking Studies.
