

Intellicast S6E31 – That’s a Wrap on Season 6!
December 19, 2023
Home or Office: Where Are You Most Productive?
January 10, 2024
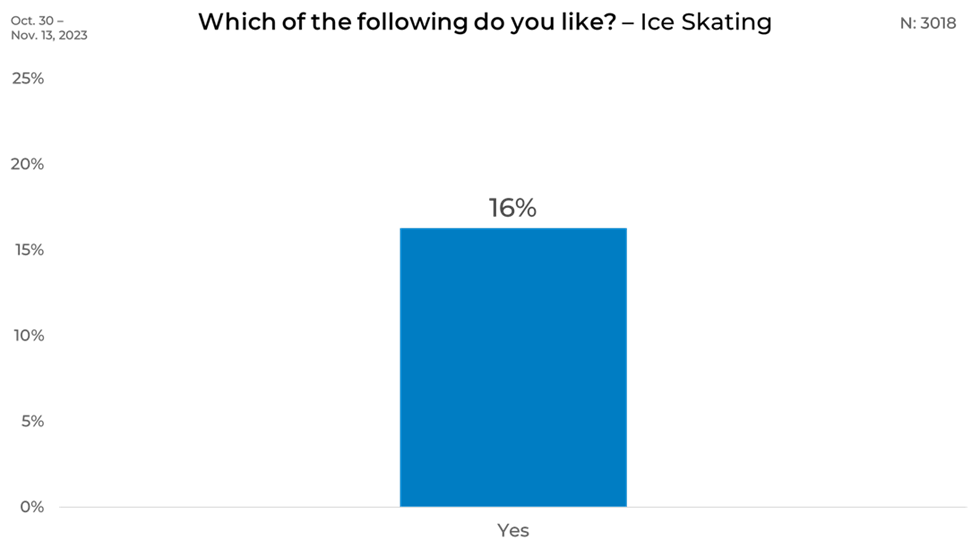
Ice skating is one of those activities that brings to mind crisp winter days and festive times. But how much do people really like it? This is something we asked about in our recent round of research-on-research.
When we look at the numbers, we see that not everyone is eager to hit the ice. This quick dip into the data will show who’s most likely to be lacing up their skates and who might prefer to keep their feet on solid ground. Let’s glide into the results and see what they reveal about the popularity of ice skating.
Ice skating, often associated with joyful winter scenes, surprisingly resonates with only a small group of enthusiasts. Just 16% of people, less than a quarter of the respondents, report enjoying the activity. The low percentage suggests that ice skating might face challenges in broader appeal despite its presence in holiday traditions and popular culture. This could be due to various factors such as accessibility, the required skill, or personal preferences for other activities.
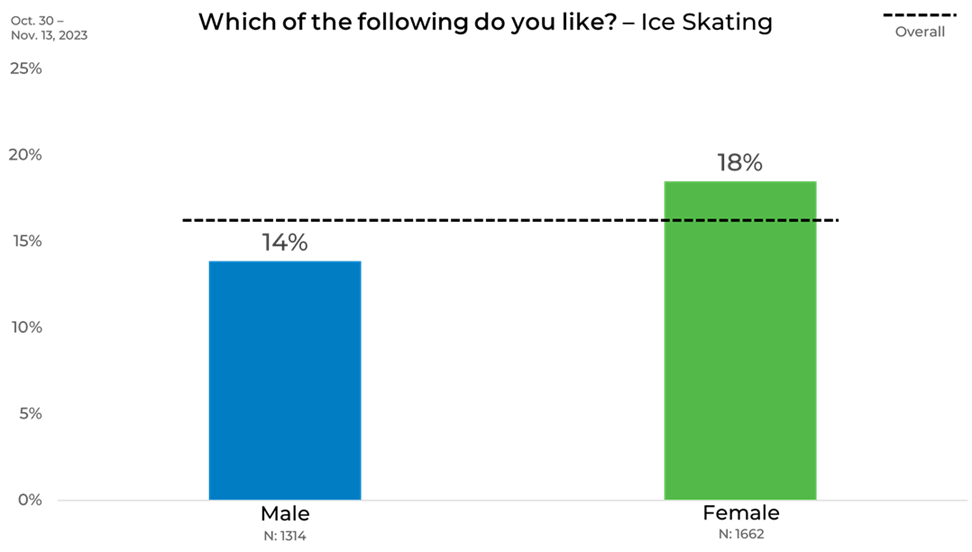
Gender
When it comes to looking at the results by gender, a split emerges, though it still reflects a pastime enjoyed by a minority. Females show a slightly higher inclination towards ice skating, outpacing males by 4%. Specifically, 18% of females enjoyed ice skating compared to 14% of males. However, it’s notable that even with this gender difference, the proportion of females who like ice skating doesn’t reach a quarter of the population. This suggests that while females might be more likely to take to the ice, the overall participation remains low across both genders.
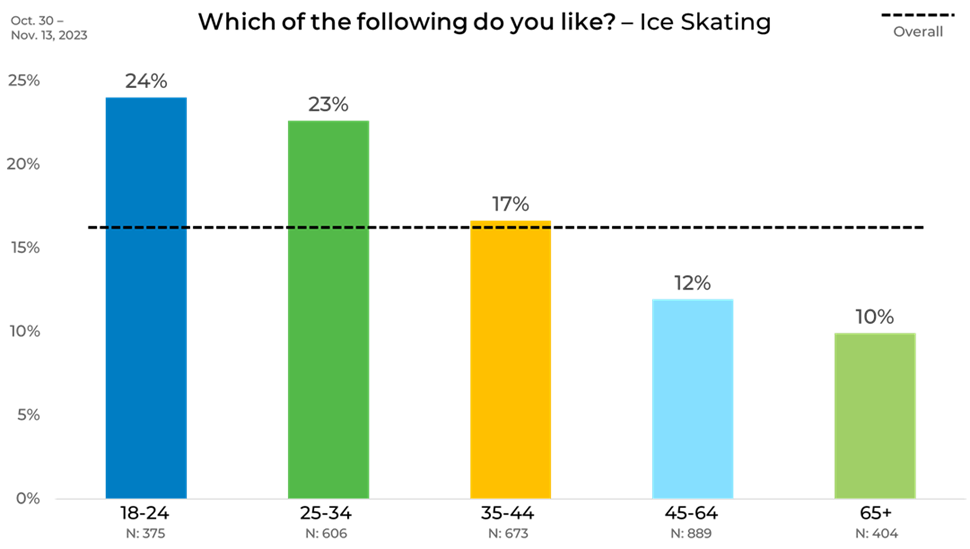
Age
Regarding ice skating, age plays a significant role in its enjoyment. The younger crowd, mainly those aged 18-24, show the highest level of interest, with 24% enjoying the glide on ice. As age increases, the likelihood of enjoying ice skating decreases, with a noticeable drop to just 10% among those aged 65 and older. This decline could be due to the physical demands of the activity or changing leisure preferences over time. The trend is clear: ice skating appeals more to the youth.
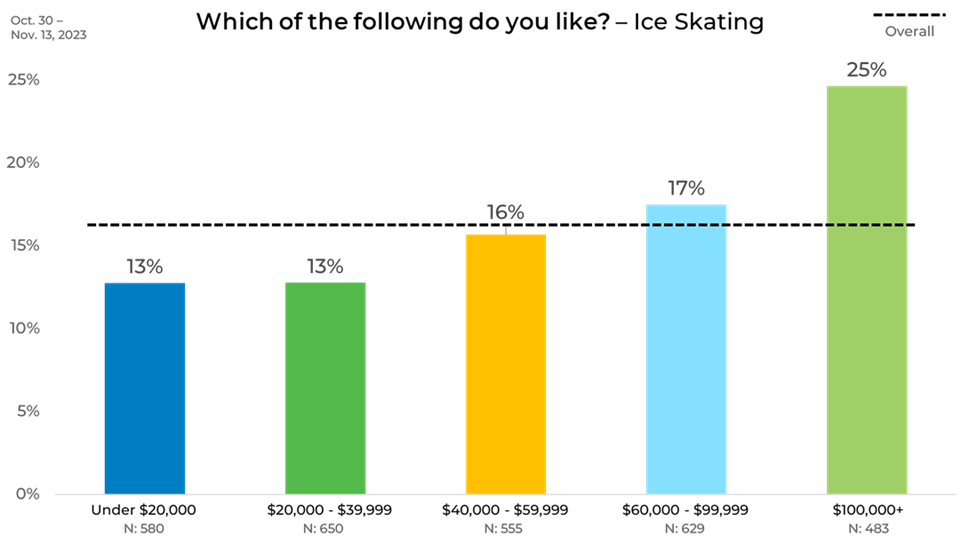
Income
Ice skating’s appeal seems to glide smoothly with income levels. Those earning over $100,000 show the highest enjoyment rate at 25%, making them the demographic with the keenest interest in ice skating. Conversely, individuals with incomes under $20,000 are less inclined, with only 13% favoring the activity. The trend is quite linear: as income increases, so does the likelihood of enjoying ice skating.
Political Affiliation
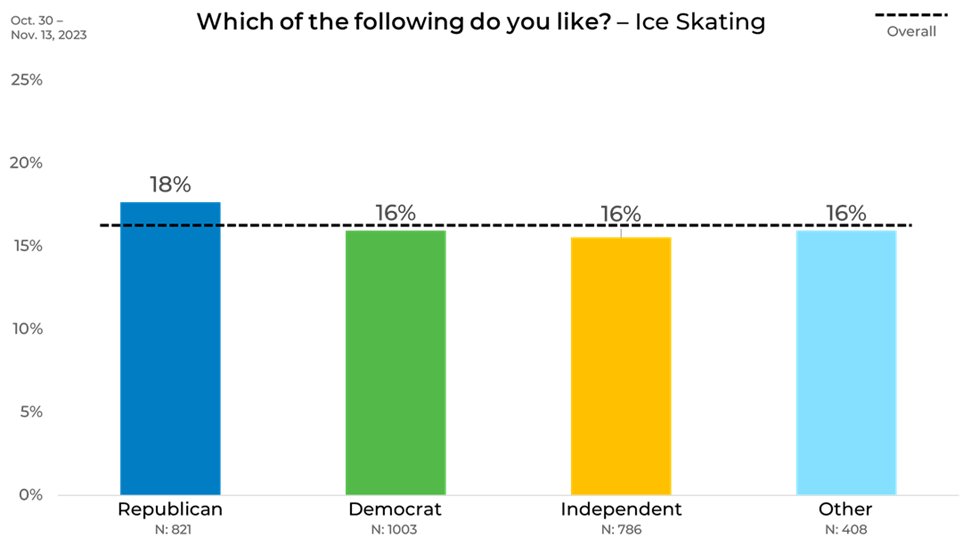
Among different political affiliations, Republicans show a marginally higher enthusiasm for ice skating, with 18% indicating they enjoy the activity. This figure is slightly more than Democrats, Independents, and those aligned with other parties, all hovering at 16%.
Ethnicity
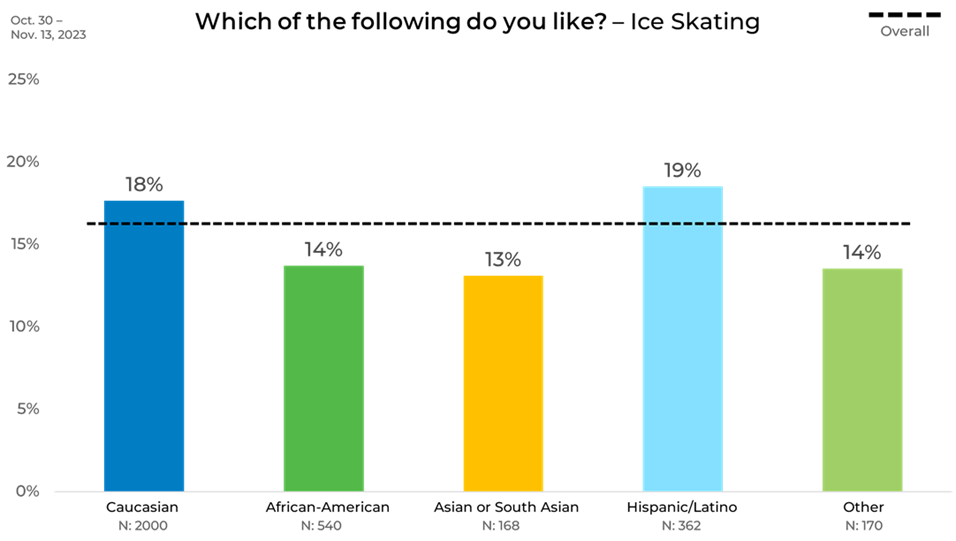
When it comes to ethnic preferences for ice skating, Hispanic/Latino individuals top the charts, with 19% enjoying the activity. They were followed closely by Caucasians at 18%. A more significant gap is seen beyond these groups, with African American individuals and those classified as ‘Other’ showing a 14% enjoyment rate. The group with the slightest affinity for ice skating is Asians or South Asians, standing at 13%.
Region
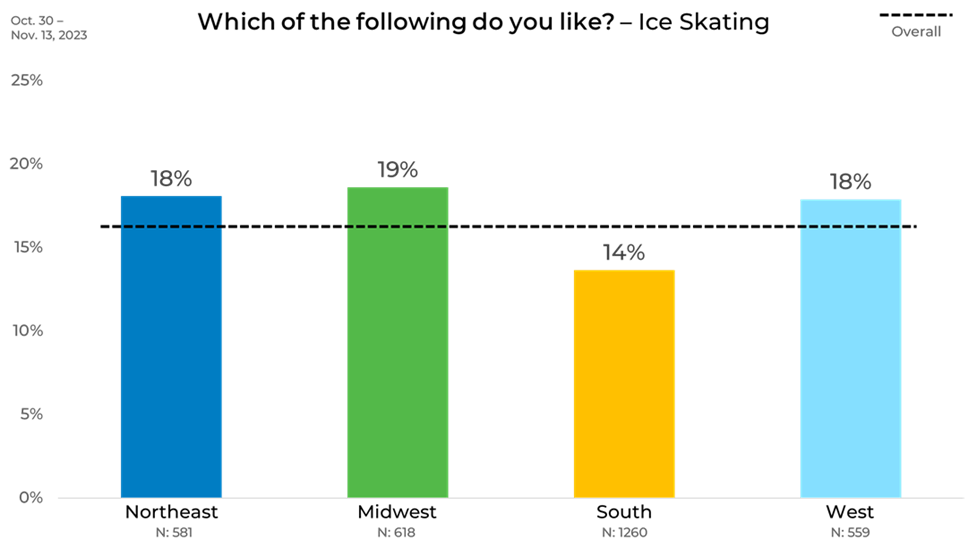
Regionally, ice skating enjoyment exhibits a varied landscape. The Midwest leads, with 19% of residents expressing a liking for the activity, with a slim edge over the Northeast and West at 18%. The South, however, shows a notable dip in ice skating enthusiasm, with only 14% of people favoring it. This regional contrast could reflect climate differences, cultural preferences, or access to skating facilities.
Panel
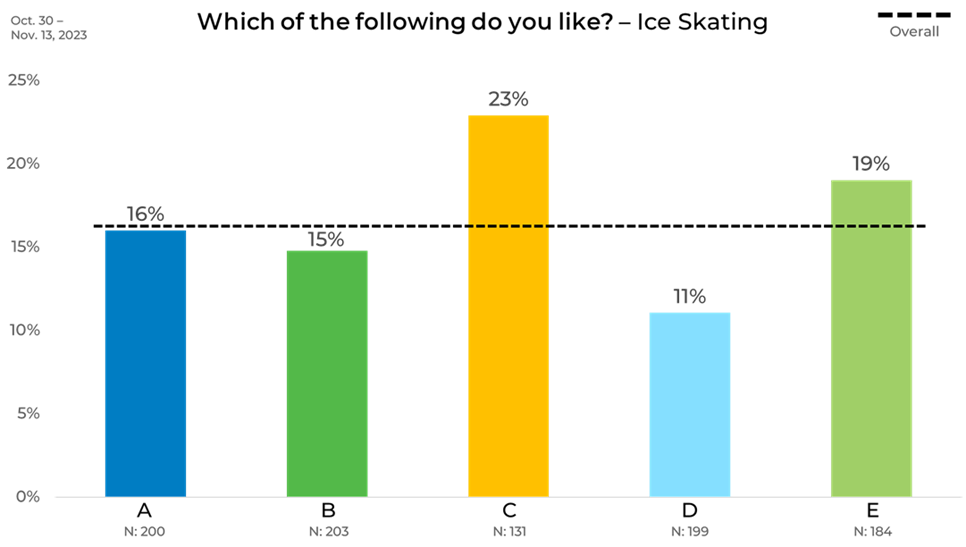
The enthusiasm for ice skating shows notable variation across different panels. Panel C stands out, with 23% of its members enjoying ice skating, which is 7% above the average. On the flip side, Panel D has only 11% of its members interested in ice skating, making it 5% below the average and the least interested group. This 12% gap between Panels C and D is the most significant difference observed, highlighting the varied levels of interest ice skating holds across different panels.
As you can see, attitudes and preferences can vary significantly across demographics and by panel, impacting your data. That is why strategically blending sample is the best practice to ensure you are accounting for demographic balance and attitudinal and behavioral as well.
Learn more about panel differences in our annual report on the sample industry, The Sample Landscape: 2023 Edition.

