
Harnessing the Power of In-Home Product Testing Panels
September 7, 2023
In-Home Usage Test (iHUT): What You Need to Know
September 19, 2023
We’re quick to say the US economy in 2023 is the worst we’ve seen in a while. However, if we look back just a few years we’ll see that this sentiment is not exactly true. In our latest round of research-on-research, we asked respondents about their feelings on the current state of the US economy. The good news is that we’ve asked respondents this question for the past three years of research-on-research, so we can compare attitudes over several years.
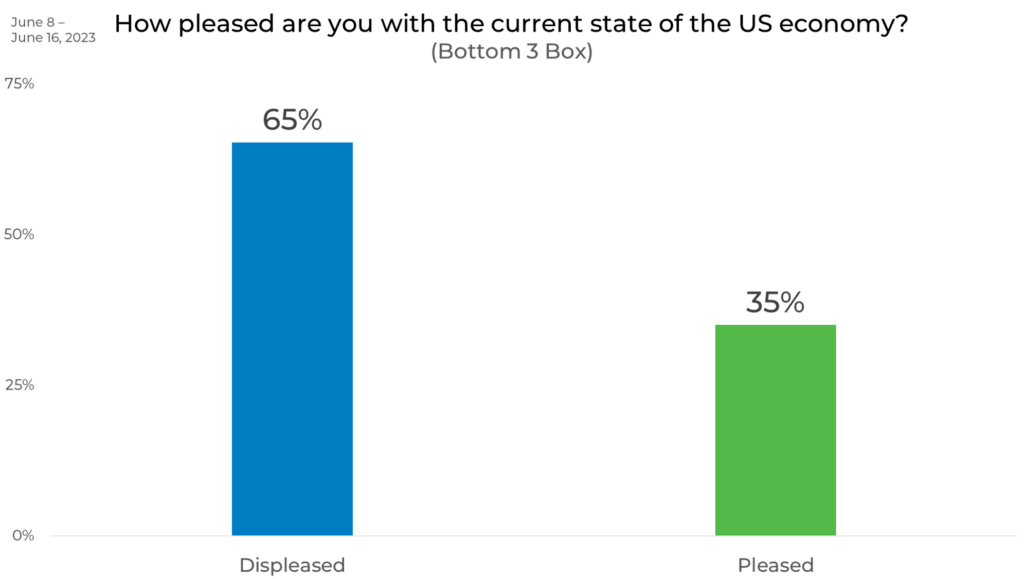
Overall, we found that over half (65%) of respondents are displeased with the current state of the US economy. This is not surprising as we’ve recently seen high inflation, layoffs, and other negative things impacting the economy.
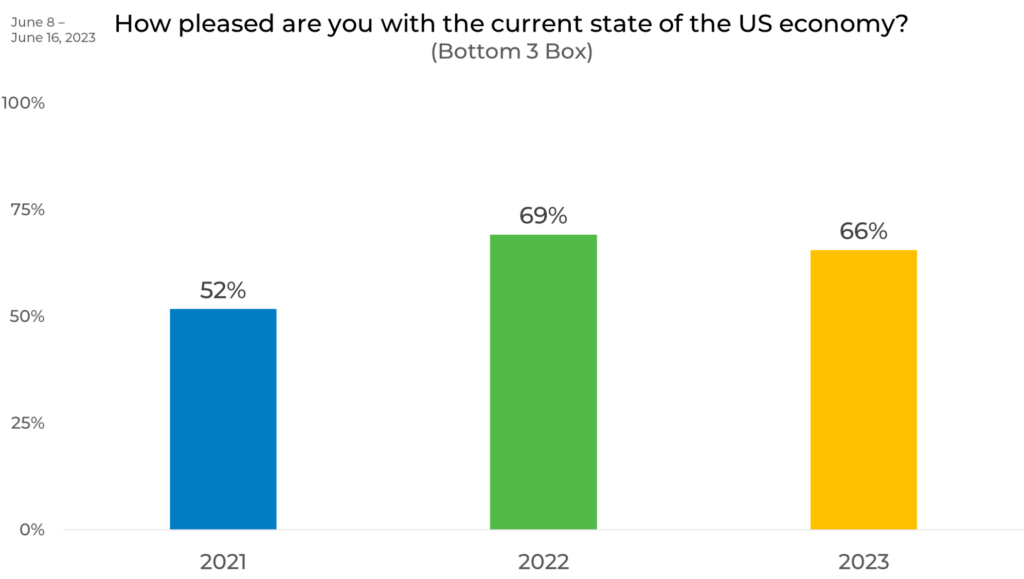
When comparing this sentiment to previous years, we see that people were most likely to be displeased with the state of the US economy in 2022 with a 17% jump from 2021. There has been a slight decrease from 2022 to 2023.
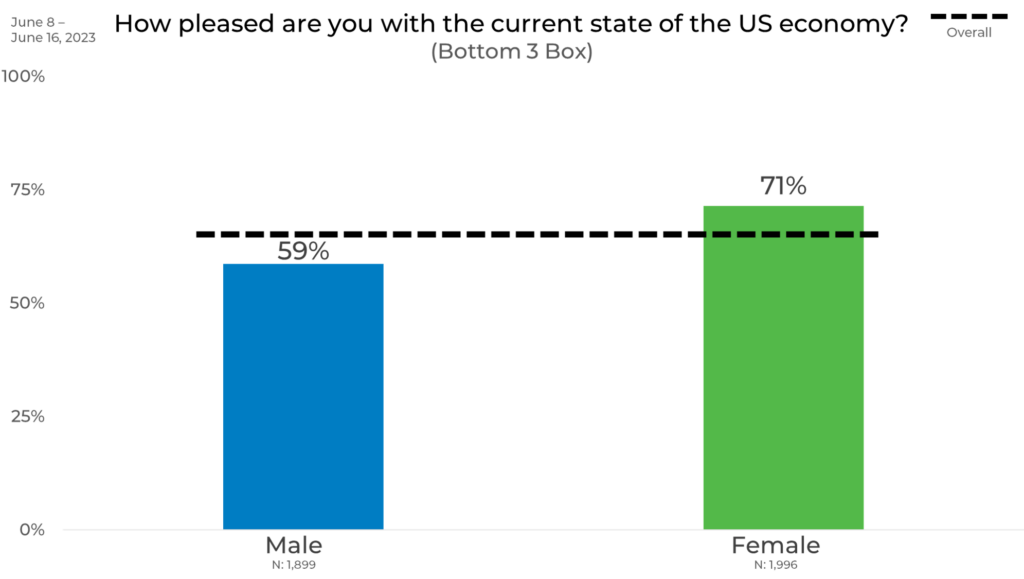
Gender
When looking at perspectives by gender, we see that females are 12% more likely than males to feel displeased with the current state of the US economy.
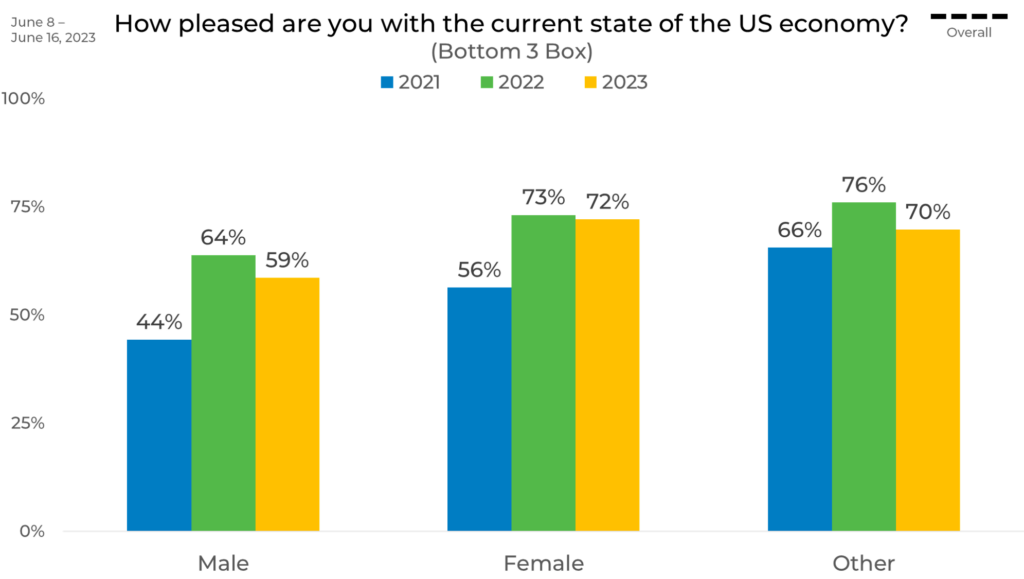
If we look at perspectives by gender year-over-year, we see that males were 20% more likely to be displeased with the state of the US economy in 2022 than in 2021. Respondents who don’t identify as male or female were the most likely to be displeased with the state of the US economy in both 2021 and 2022 while females are the most likely to be displeased with the state of the US economy in 2023. Both men and women hit peaks of displeasure with the state of the economy in 2022.
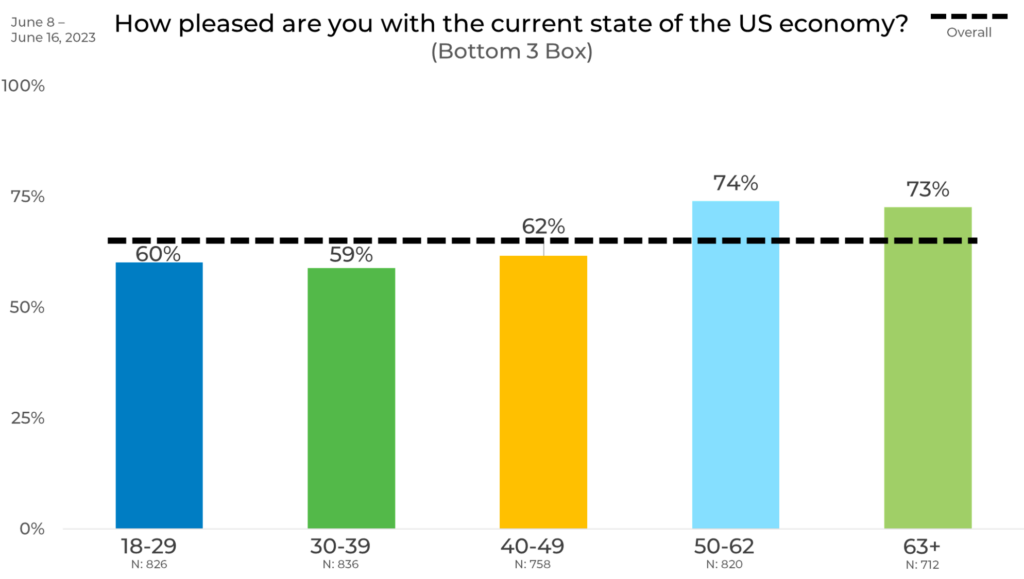
Age
When it comes to age, we see a slight trend where the older a person is, the more likely they are to be displeased with the current state of the US economy. 30-39 year-olds are the least likely to be displeased with the current state of the US economy (15% less likely than 50-62 year olds who are the most likely to be displeased.) This makes sense as the older portions of the population are either retired or nearing retirement and want a strong economy to feel comfort in a decision to retire.
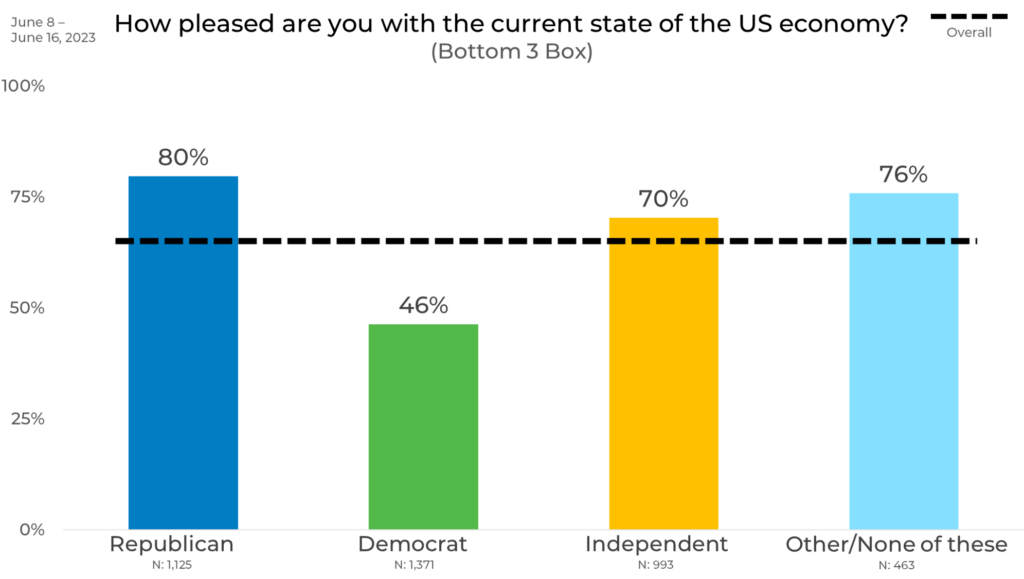
Political Affiliation
If we look at perspectives by political affiliation, we see that the results are split among party lines with Republicans being the most likely to be displeased with the current state of the US economy (34% more likely than Democrats who are the least likely to feel displeased.) It will be interesting to watch the attitudes of Independents as they will provide the swing votes in the upcoming election.
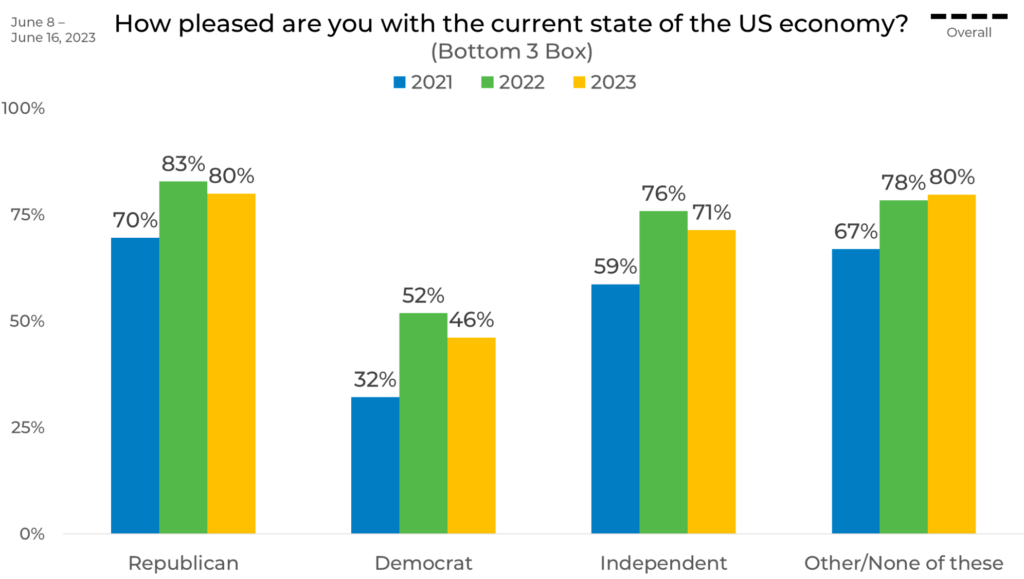
We can also look at perspectives by political affiliation year-over-year. Here we see that Republicans are most likely to be displeased with the state of the US economy each year with large differences when compared to Democrats. Republicans were 38%, 31%, and 34% more likely to be displeased with the state of the US economy than Democrats in 2021, 2022, and 2023, respectively. Democrats saw the largest variance in 2022 when they were 20% more likely to be displeased with the economy than the previous year.
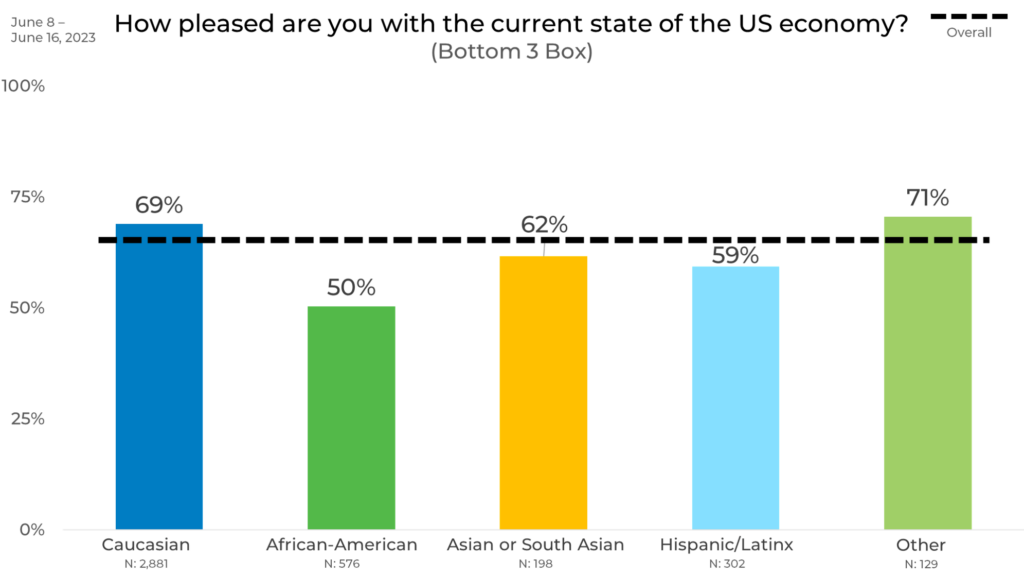
Ethnicity
When it comes to ethnicity, we see that Caucasians are the most likely to be displeased with the US economy. African Americans are the least likely to be displeased with the current state of the US economy (19% less likely than Caucasians.) According to the Economic Policy Institute, in Q2 of 2023 the nationwide Black-white unemployment rate is 2.0-1.0 which may factor into displeasure with the current US economy.
Region
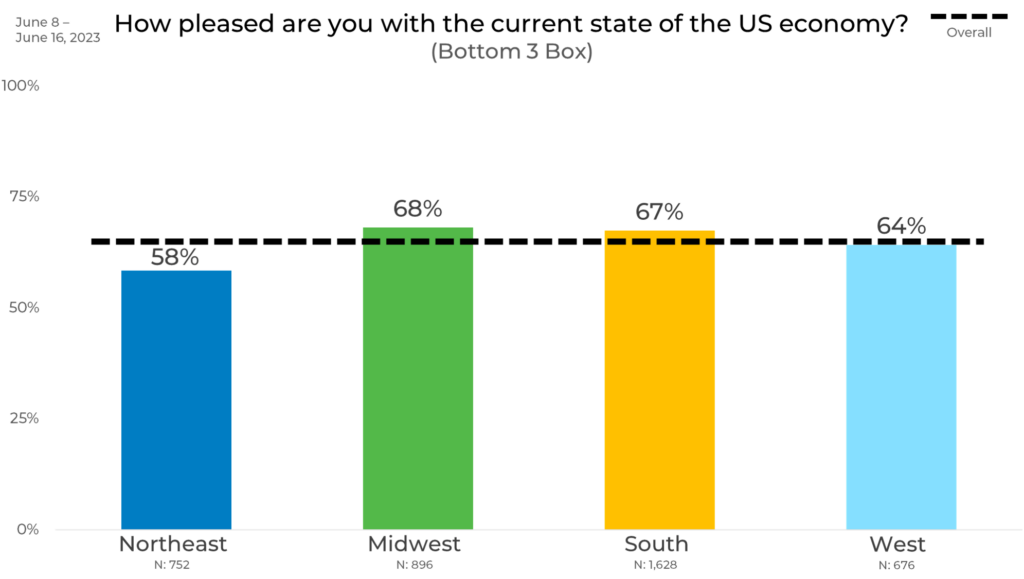
By region, we see that people in the Northeast are the least likely to be displeased with the current state of the US economy (10% less likely than those in the Midwest.) People in the Midwest are the most likely to be displeased with the current state of the US economy.
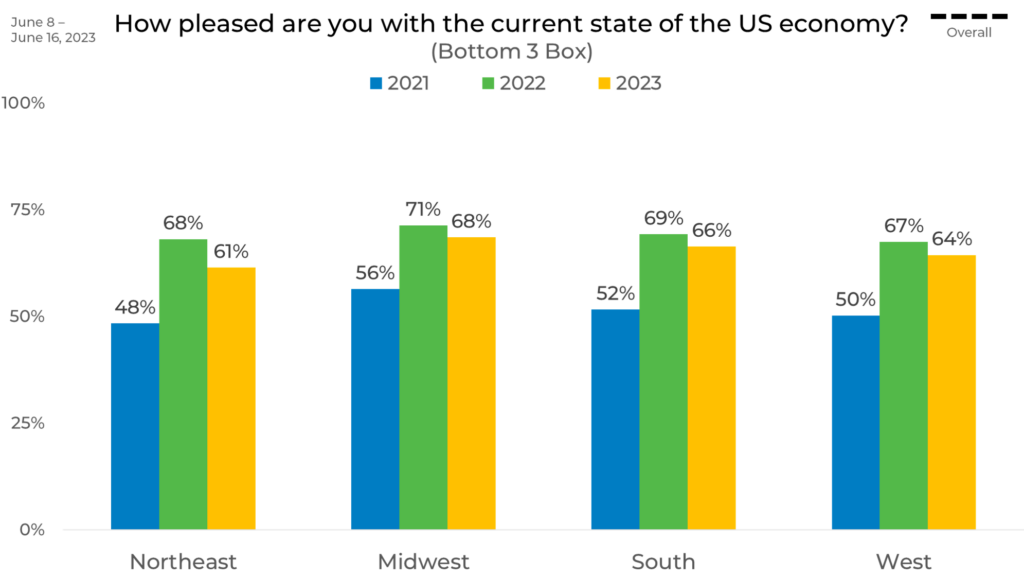
When we look at perspectives by region from 2021 to 2023, we see that 2022 continued to be the year where people were most likely to feel displeased about the state of the US economy. In fact, every region saw a 15%+ increase in percentage of people feeling displeased from 2021 to 2022. People in the Midwest are most likely to be displeased with the state of the US economy every year from 2021 to 2023.
Panel
Finally, we look at responses by panel. Here we see differences in perspectives of the US economy up to 37% as seen between Panels C and E. These differences can be due to a variety of reasons including panel management, incentive, and more. For instance, Panel E might have more males who we know are more likely to feel displeased with the state of the US economy.
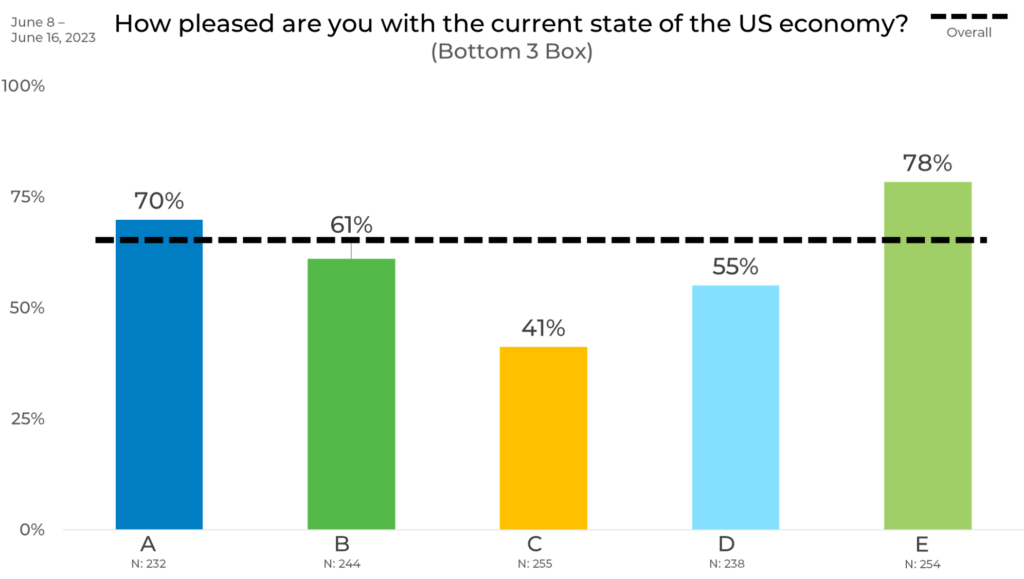
As we see in this blog, attitudes and behaviors can vary greatly by both demographic and panel. This can have a significant impact on your data. For instance, if someone only used Panel C for their research, they might think way more people are pleased with the current state of the US economy than actually are. This is why strategic sample blending is the best practice to ensure any changes in your data are due to shifts in the market, not inconsistencies in your data.
Want to see how you can account for panel bias in your tracker? Download our new whitepaper, Strategic Sample Blending: The Premier Sample Methodology for Tracking Studies!

