

Intellicast S6E20 — Putting the “X” in MRX
July 28, 2023Intellicast S6E21 – Zoom AI, Media Measurement, and More
August 11, 2023
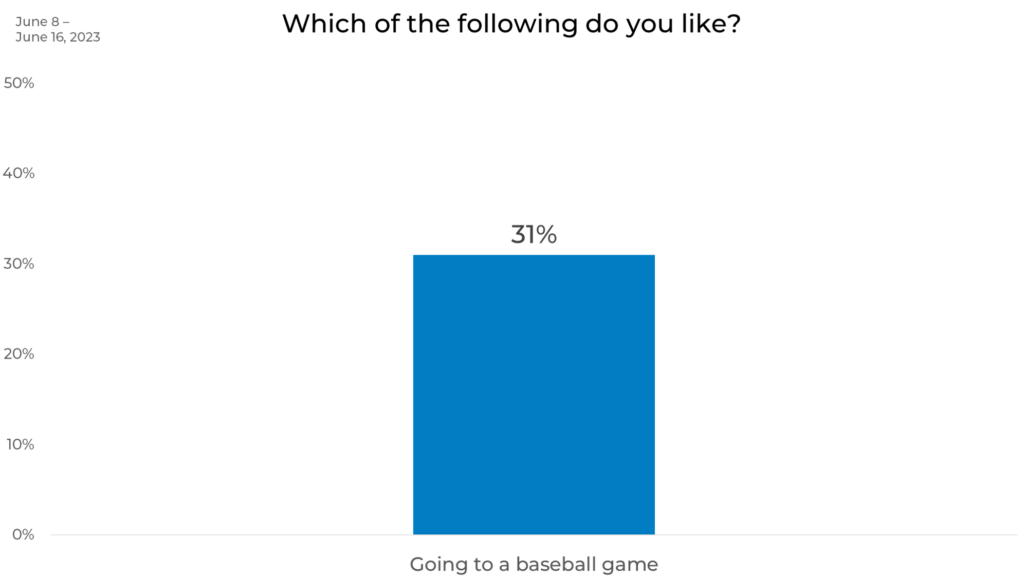
Batter up! If you haven’t heard, we’re having a pretty good summer in Cincinnati—at least when it comes to baseball. The Cincinnati Reds enjoyed an incredible season thus far and had some awesome new players contributing to the team including Elly de la Cruz, Andrew Abbott, and Matt McLain. With all the excitement, we decided to look at who’s going to be out at the ballgame in our latest round of research-on-research.
Overall, about 1 in every 3 people like going to baseball games. According to ESPN, the top 3 teams in the MLB with the highest average attendance are the LA Dodgers, New York Yankees, and St. Louis Cardinals, respectively.
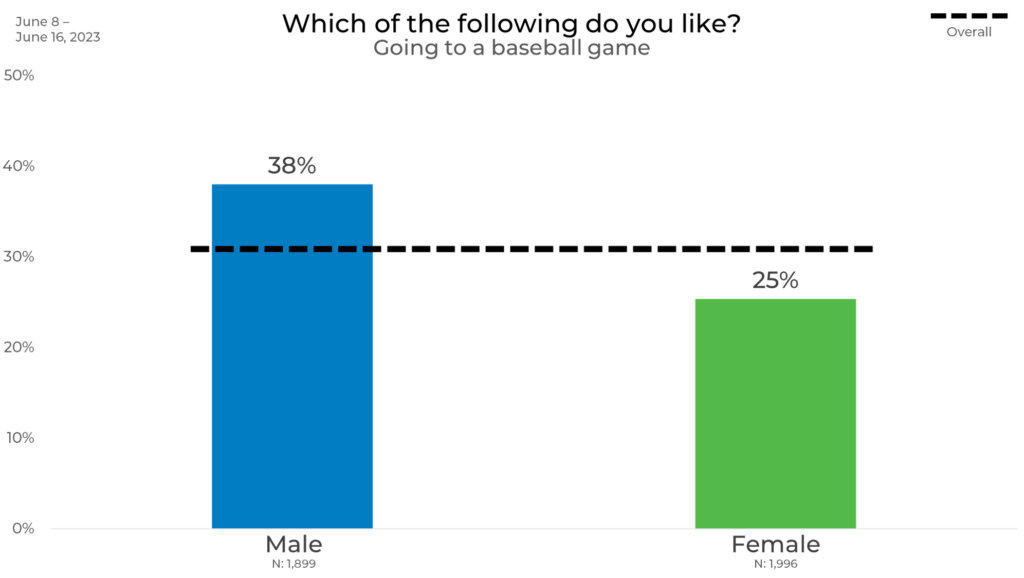
Gender
When looking at response by gender, we see that males are 13% more likely to go to baseball games than females. This is unsurprising as males are 29% more likely to identify as avid sports fans than females.
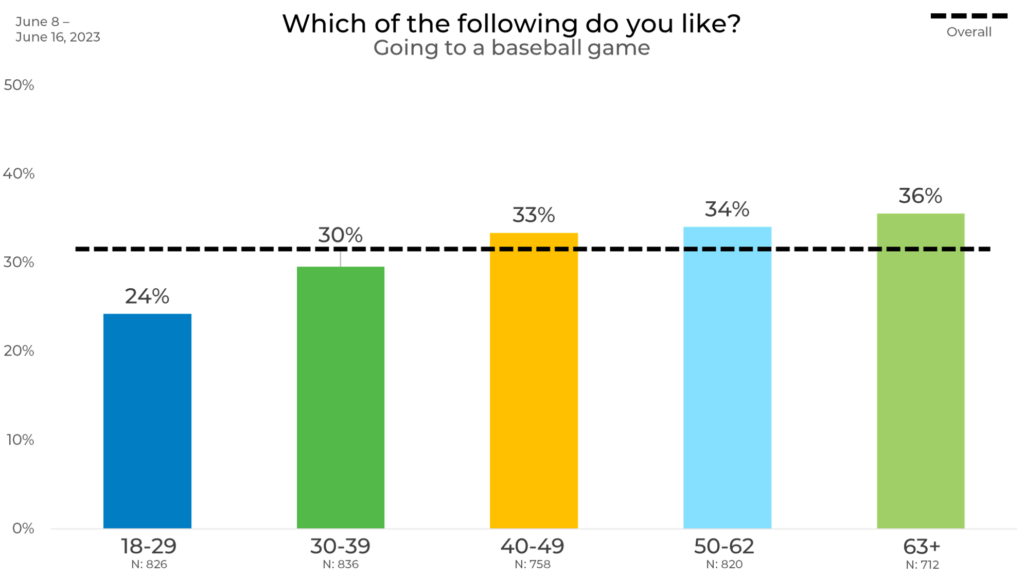
Age
We also looked at those who like going to baseball games by age. Here we see that the older a person is, the more likely they are to go to baseball games. People aged 63+ are the most likely to say they enjoy going to baseball games. In fact, they are 12% more likely than people aged 18-29.
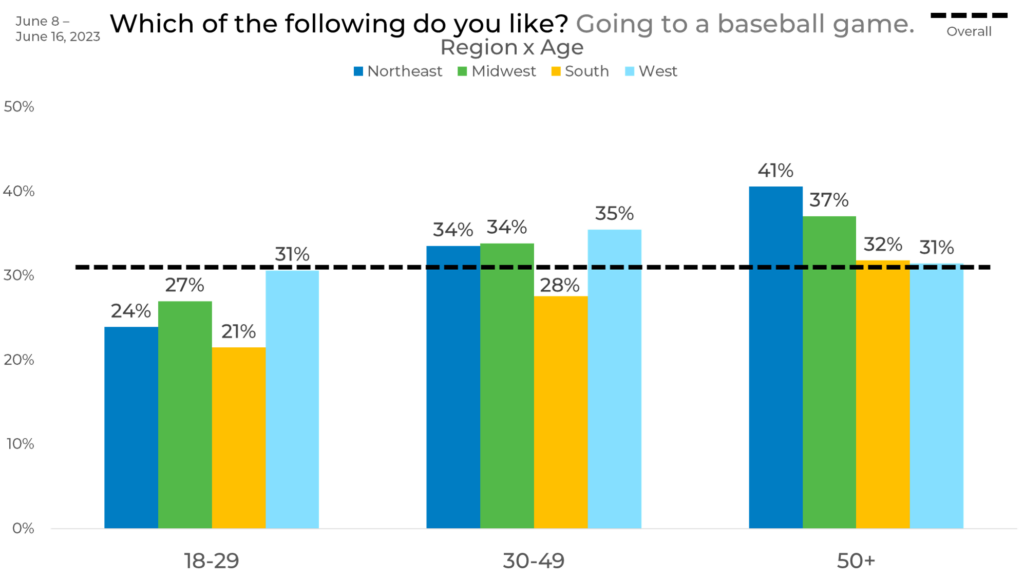
We can also cross reference age and region. Here we see that 18-29 years olds in the West are 10% more likely than 18-29 year olds in the South to enjoy going to baseball games. Respondents age 50+ in the Northeast are 10% more likely to enjoy baseball games than those age 50+ in the West. In the Northeast, respondents age 50+ are 17% more likely than 18-29 year olds to enjoy baseball games.
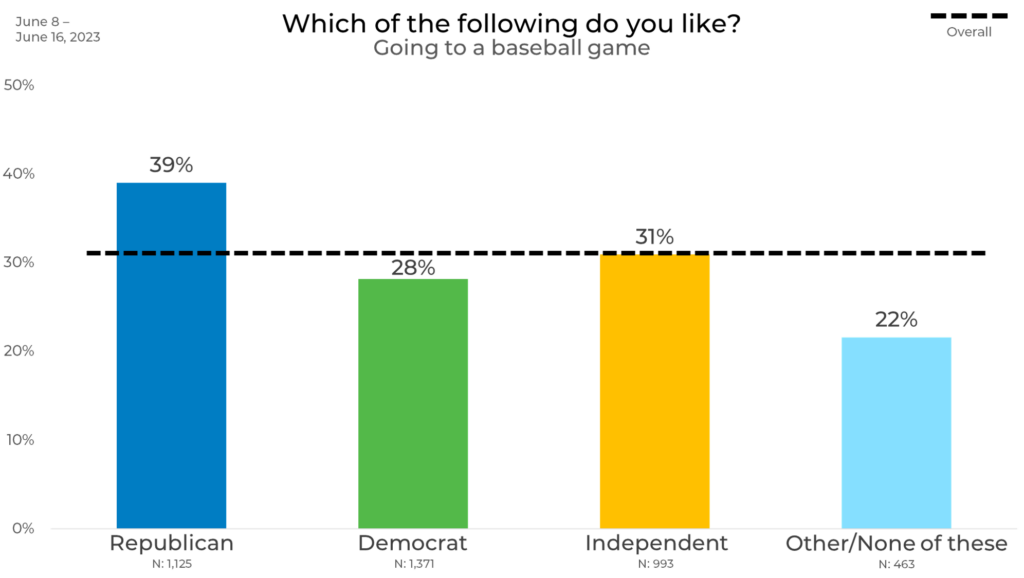
Political
When it comes to political affiliation, Republicans are the most likely to say they enjoy going to baseball games. Republicans are 11% more likely to go to baseball games than Democrats and 8% more likely than those who identify as Independent.
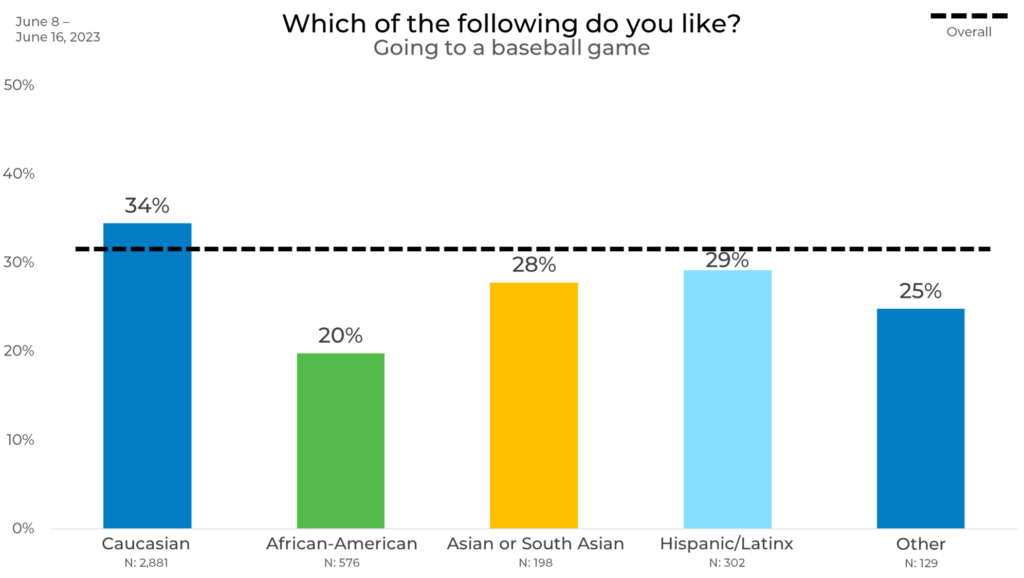
Ethnicity
If we break response down by ethnicity, we see that Caucasians are the most likely to go to baseball games (6% more likely than any other ethnicity.) African Americans are the least likely to go to baseball games (14% less likely than Caucasians.)
Panel
Finally, we looked at responses by panel. Here we see differences up to 13 percentage points in those who say they like going to baseball games. These differences can be due to a variety of reasons including panel management, incentive, and more. For instance, Panel E might have more older respondents who we know are more likely to enjoy going to baseball games.
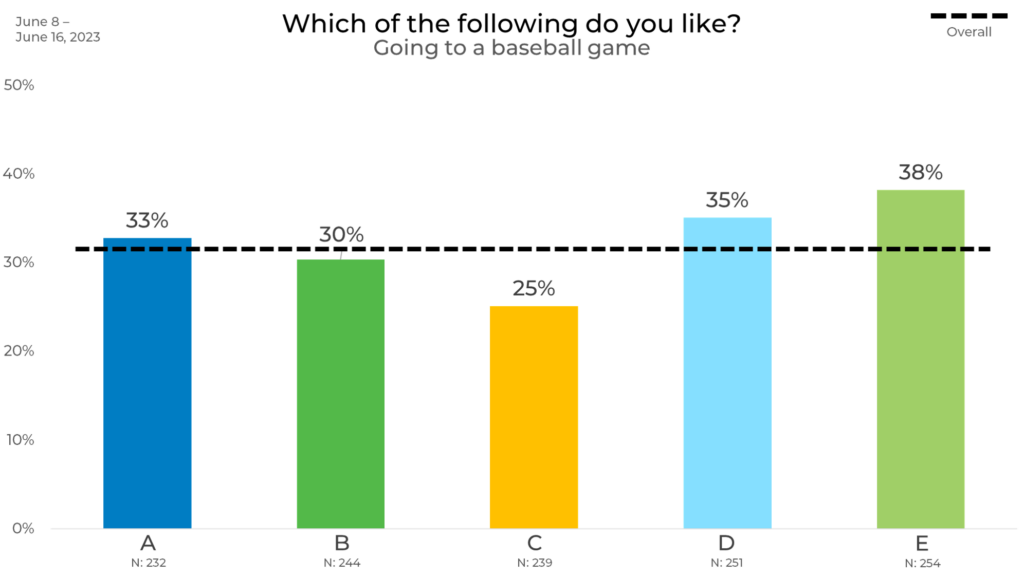
As we see in this blog, attitudes and behaviors can vary greatly by both demographic and panel. This can have a significant impact on your data. For instance, if someone only used Panel C for their research, they might think way fewer people like going to baseball games than actually do. This is why strategic sample blending is the best practice to ensure any changes in your data are due to shifts in the market, not inconsistencies in your data.
Learn more about panel differences in The Sample Landscape: 2023 Edition!

