
Intellicast S6E11 – Current Events, Conferences, and More
April 24, 2023Intellicast S6E12: Was the IA Annual the Best Conference Ever?
May 8, 2023
May is Mental Health Awareness month! During this month, many people and brands will recognize efforts being made to stop the stigma regarding mental health. In our latest round of research-on-research, we asked respondents about their current mental health and experience with several mental health issues.
This blog deals with some sensitive topics surrounding mental health and may not be suitable for all readers.
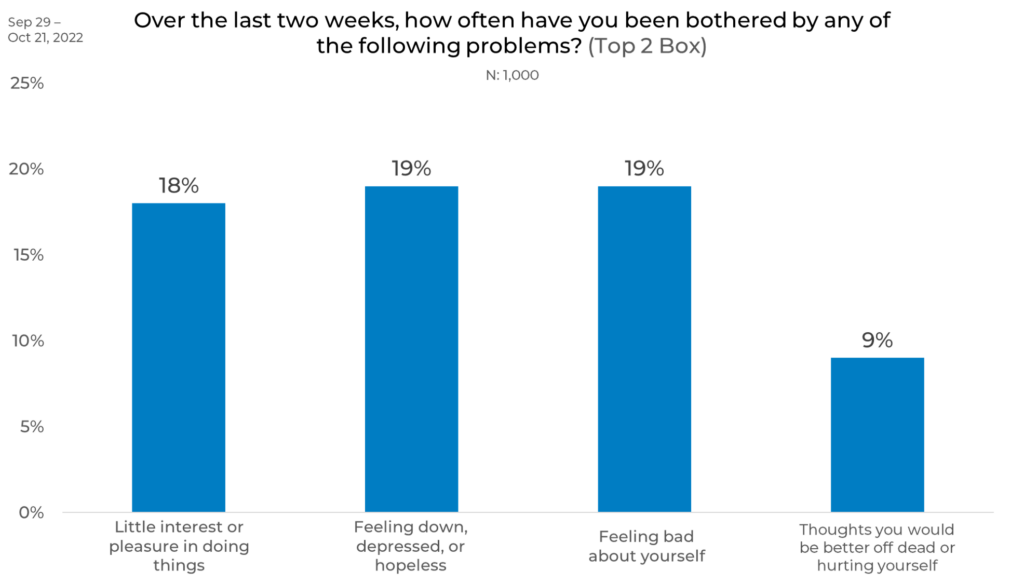
In this blog, each graph is a representation of the percentage of respondents that have been bothered by these problems, saying they experience them “more than half the days” or “nearly every day” in the last 2-week period.
Overall, just under 20% of respondents have experienced mild to moderate symptoms of depression, and just under 10% struggled with severe symptoms of depression. According to the U.S. News and World Report, nearly 10% of Americans 12 and older have experienced depression. Nearly 5% of adults have experienced severe mental illness according to Mental Health America (4% less than we found in our study.)
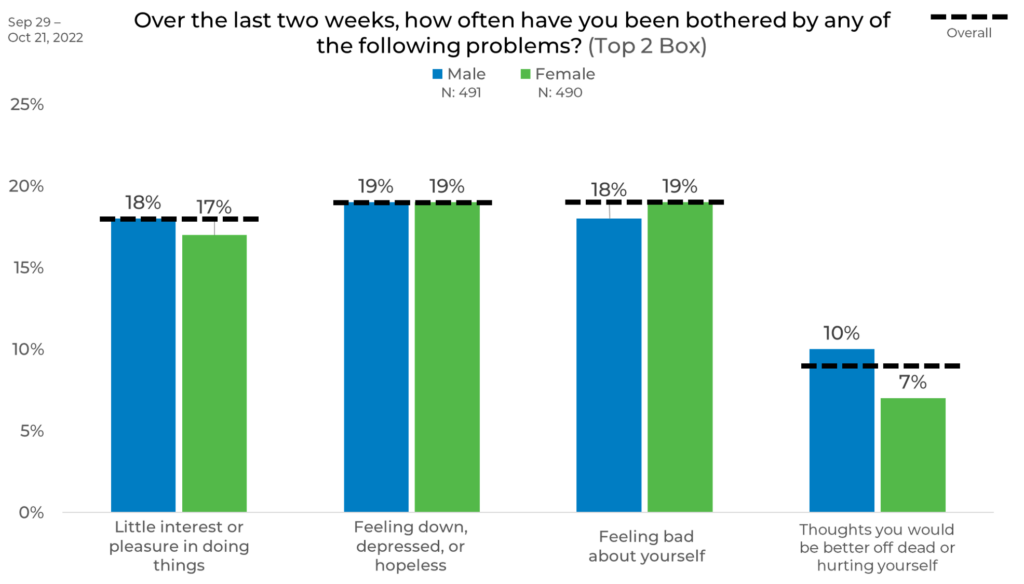
Gender
When looking at responses by gender, we found that the results for both males and females were almost equal in terms of experiencing the mental health issues we asked about. However, males are 3% more likely to say they experience thoughts that they would be better off dead or hurting themselves. This finding dispels the stigma that men do not experience mental health issues as often as women do.
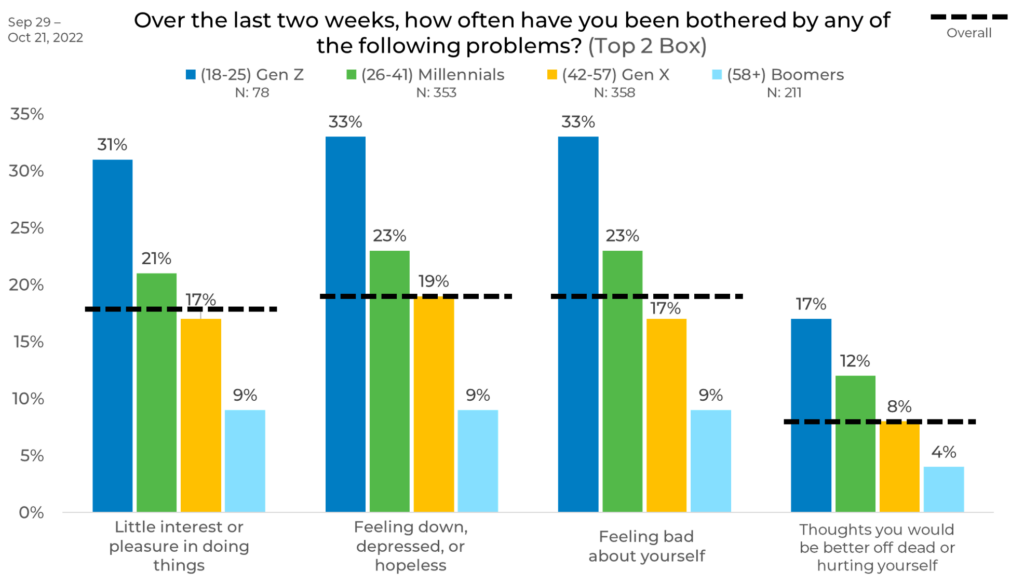
Age
We also looked at experience of mental health issues by age. Here we found that there is a correlation between age and mental health. The older a person is, the less likely they are to say they have been bothered by these problems. Gen Z are the most likely to have been bothered by these problems (13%, 14%, 14%, and 8% higher than the overall average, respectively.) Some of these findings may be due to the recent decline in stigma surrounding conversations about mental health among younger generations. Older respondents could be less likely to discuss issues in their mental health due to the ingrained stigma around it.
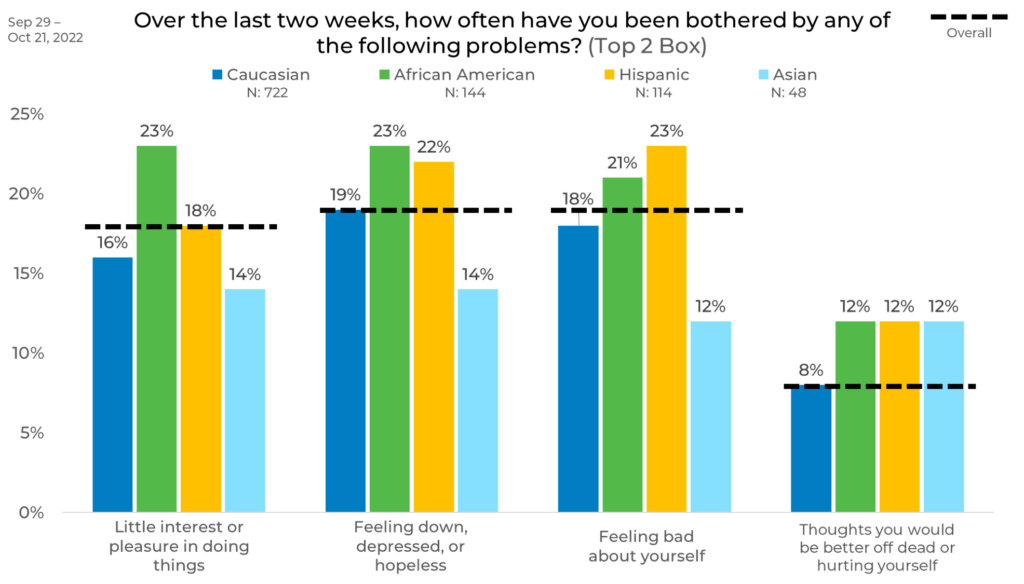
Ethnicity
When it comes to ethnicity, African American respondents are the most likely to experience little interest or pleasure in things and most likely to feel down, depressed, or hopeless. Hispanic respondents are the most likely to feel bad about themselves. Here, we see differences up to 5% higher and 7% lower than the overall average by ethnicity.
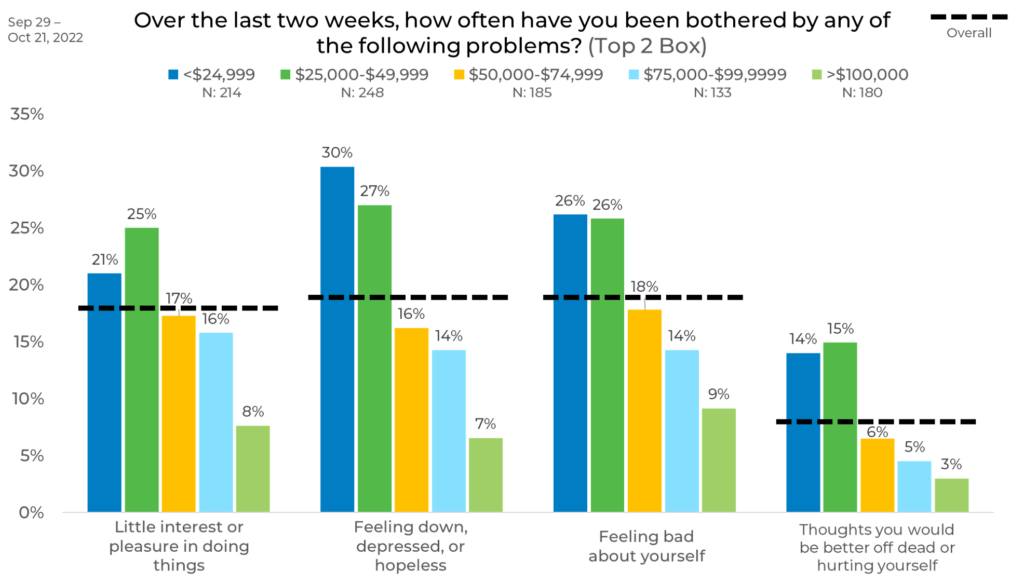
Income
Our findings based on income are interesting—can money actually buy happiness? We found that the higher a person’s income, the less likely they are to have been bothered by the following problems. In fact, less than 10% of people with incomes above $100,000 have experienced these mental health issues. Those with incomes below $50,000 are all above the overall average for experiencing these mental health struggles, while all respondents with incomes above $50,000 are below the overall average.
While this might lead people to believe money can buy happiness, it could be due to a variety of factors. For instance, this disparity could be due to the fact that people with higher incomes are more likely to be able to afford resources to help deal with mental health issues. It may also be a correlation showing that those without mental health issues are more likely to be more successful and/or have higher incomes, etc.
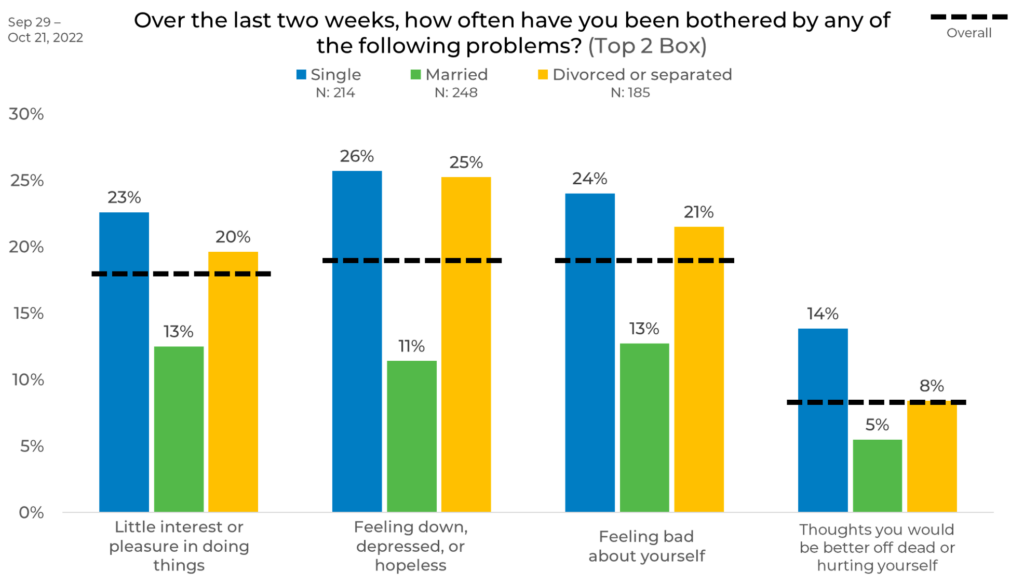
Marital Status
For this blog, we also looked at response by marital status. We found that married people are the least likely to experience these mental health issues. Single people are the most likely to experience these issues, though just slightly higher than those that are divorced or separated. Here we see differences up to 7% higher and 8% lower than the overall average.
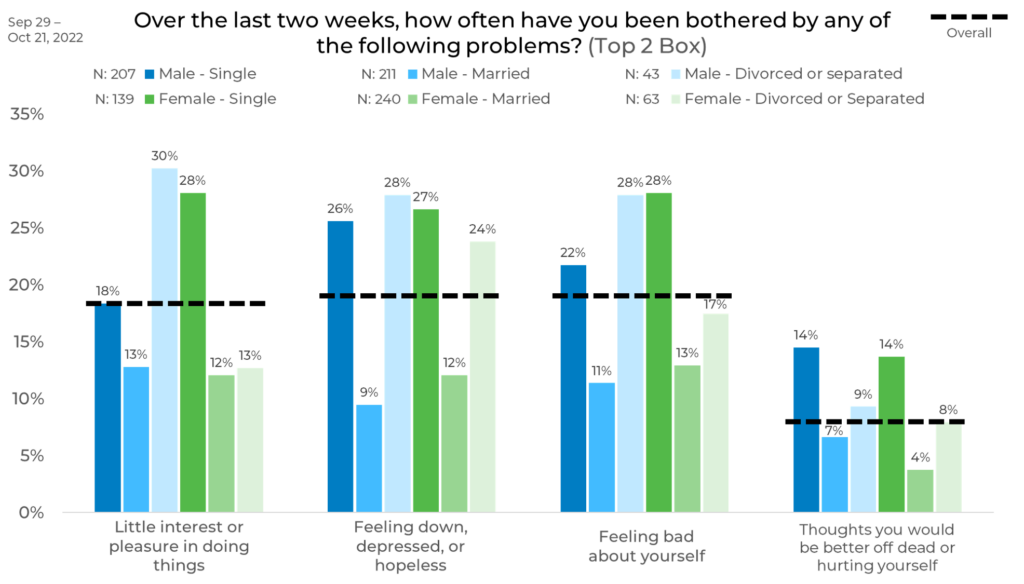
Marital Status by Gender
We dove a little deeper and looked at response by marital status and gender. We first note that we had smaller sample sizes for males and females that are divorced/separated. Divorced/separated males and single females are the most likely to have been bothered by these problems in the last two weeks. Single males and single females are the most likely to have had thoughts that they would be better off dead or hurting themselves.
Again, we see that people who are married, no matter their gender, are the least likely to have been bothered by these problems in the past two weeks, followed by single males and divorced/separated females. Here we also see responses up to 12% higher and 10% lower than the overall average.
Panel
When looking at responses by panel, we see that Panel B is the most likely to have been bothered by these mental health problems with both Panel A and Panel B having responses above the overall average. Panel C has the lowest percentage of respondents who have struggled with these issues in the last two weeks, up to 6% lower than the overall average. This can be due to differences in panel makeup, management, and more. For instance, Panel C may have more married Gen Xers and Boomer respondents, who are less likely to say they have experienced these issues.
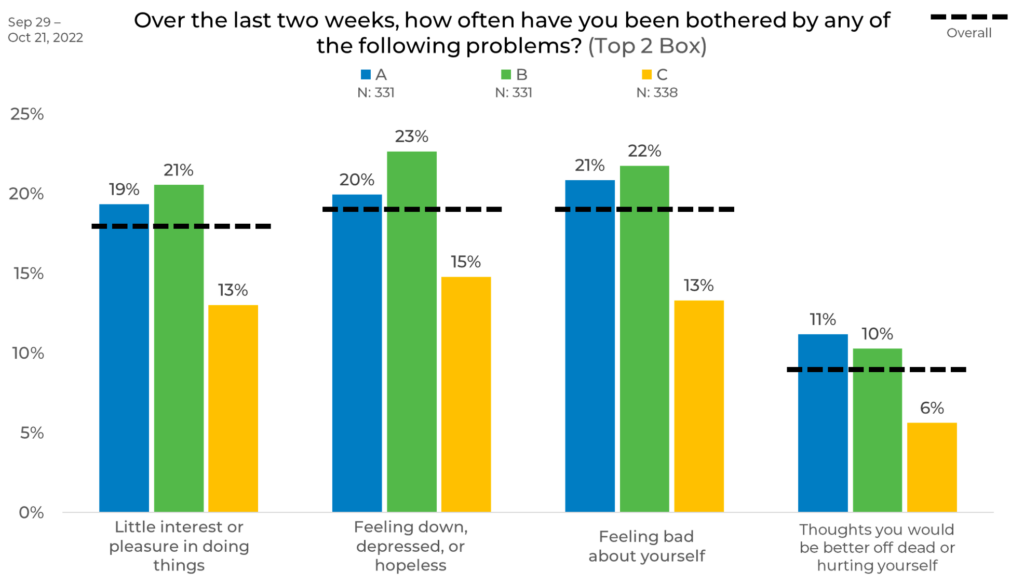
As we see in this blog, consumer experiences vary greatly by both demographic and panel. This can have a significant impact on your data! For example, if someone only used Panel C, they might think that fewer people struggle with mental health than actually do, which could have serious effects. This is why strategic sample blending is the best practice to ensure any changes in your data are due to shifts in the market, not inconsistencies in your data.

