Intellicast S5E14: It’s Good to Be Back
April 29, 2022
Let’s Work this Out: Exercise Levels by Demographic
May 9, 2022
There has been a growing focus on diversity and inclusion in not only the market research industry but all industries in recent years. It’s an important topic of conversation that has an impact on research and the places we work. In our recent round of research-on-research, we continued to look at diversity in relation to gender, income, and ethnicity for 2022. We asked questions surrounding how respondents feel their identity impacts their experience in the workplace.
Overall
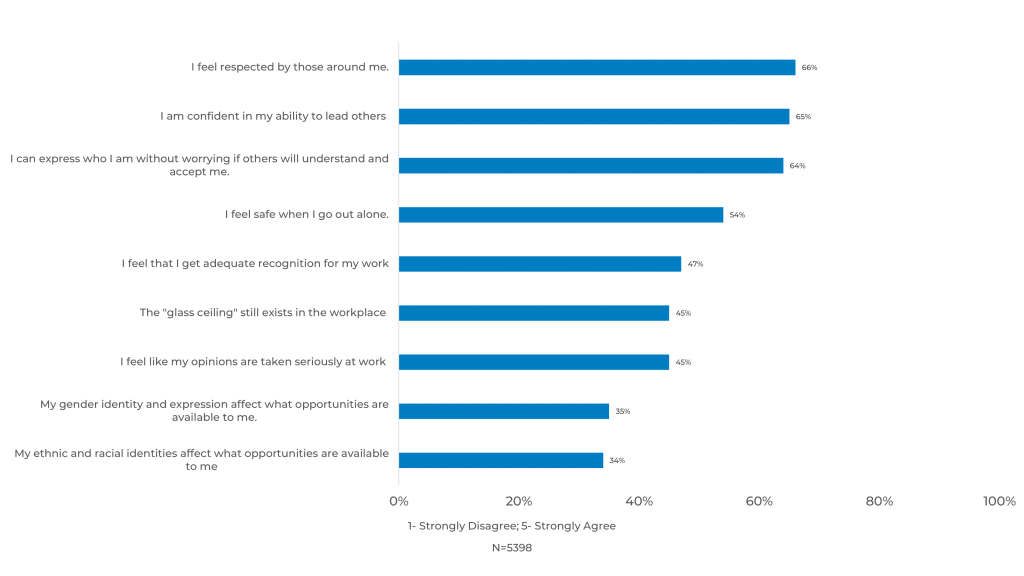
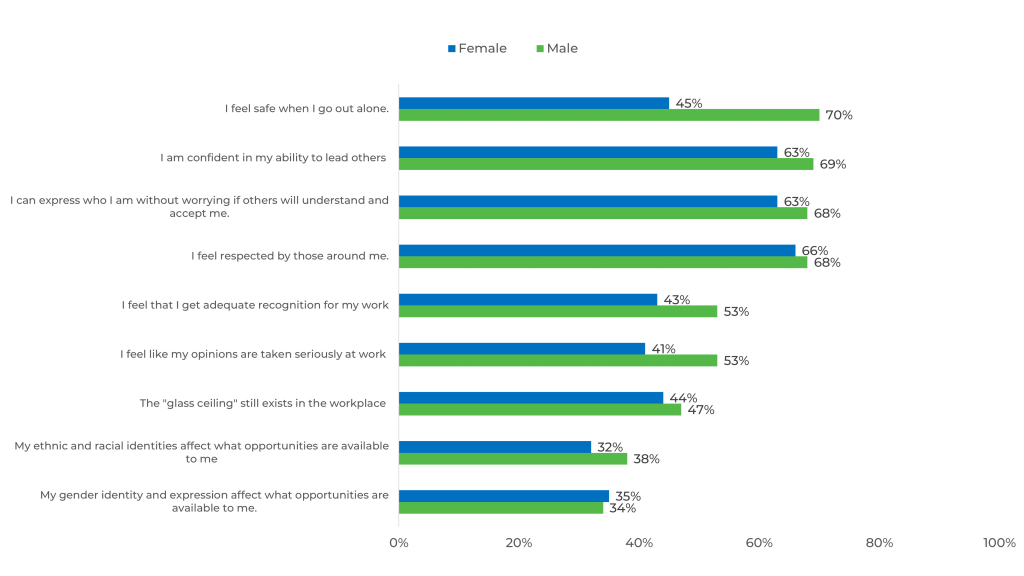
Overall, we see that the majority of respondents feel comfortable expressing who they are, respected by those around them, safe when going out alone, and are confident in their ability to lead others. We asked these questions on a scale of 1-5, 1 being strongly disagree and 5 being strongly agree.
35% of respondents feel that their gender identity and expression affect the opportunities available to them and 34% feel that their ethnic and racial identities affect the opportunities available to them.
Gender
When asking gender questions in our research-on-research, we offer multiple answer options to be inclusive of all respondents in order to give them the most positive survey experience. Along with male and female options, respondents were able to identify as transgender, non-binary, questioning, other, or prefer not to answer among a variety of other responses. Due to small sample sizes of respondents who chose these options, we will focus on respondents who identify as male or female for the purpose of comparisons in this study.
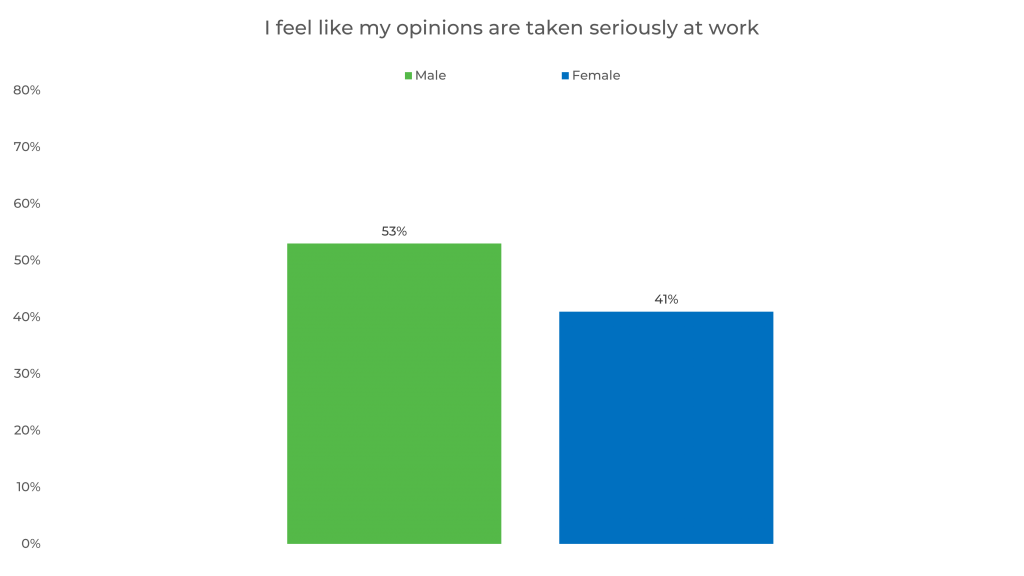
There are significant differences in agreement between males and females to different statements about the workplace. For example, female respondents are 12% less likely than male respondents to feel that their opinions are taken seriously at work.
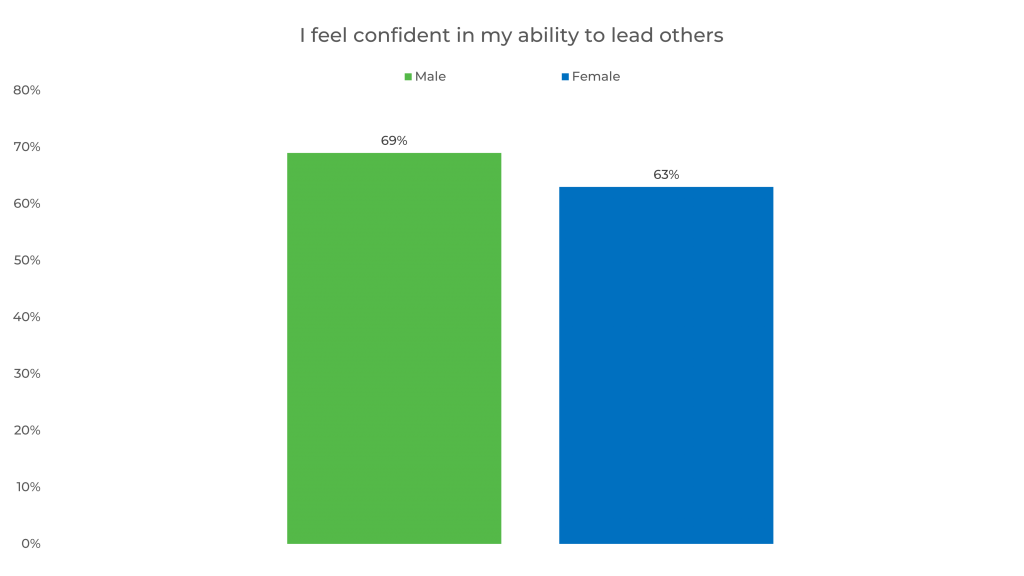
Females are also 6% less likely than males to feel confident in their ability to lead others.
There is also a 17% difference between male and female respondents who feel safe when going out alone.

Here, you can see responses by gender for all statements. The only statement that females were more likely to agree with than males is that their gender identity and expression affect what opportunities are available to them.
Income
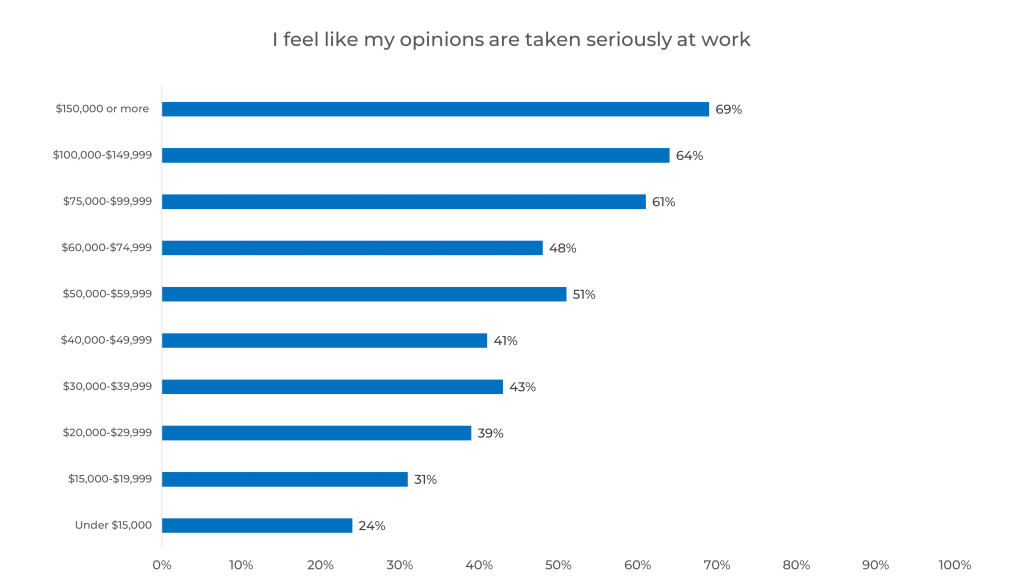
We also looked at differences in response by income. When looking at respondents by income, we see that, in general, respondents with higher incomes are more likely to feel that their opinions are taken seriously at work.
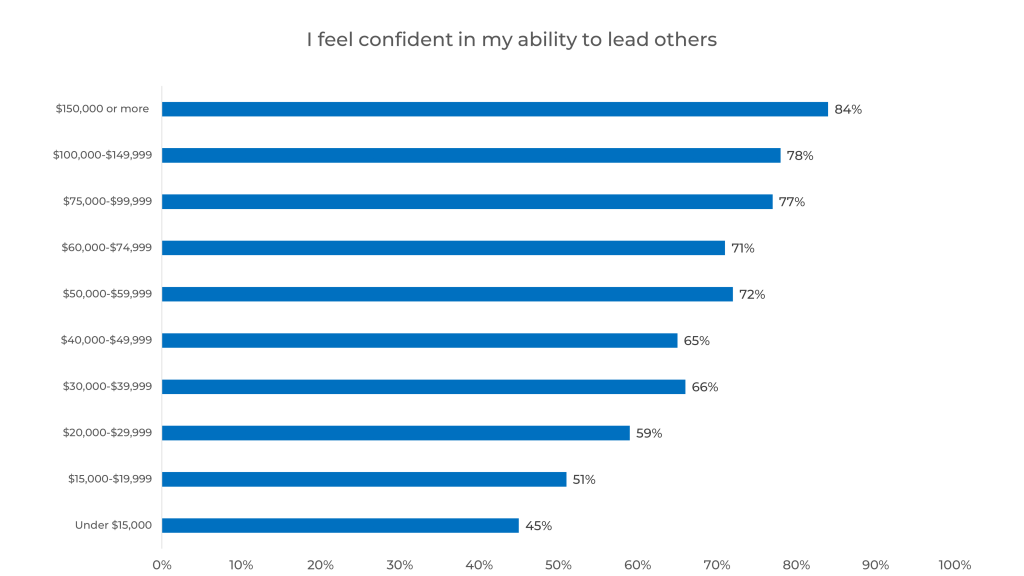
Similarly, respondents with higher incomes are also more likely to feel confident in their ability to lead others.
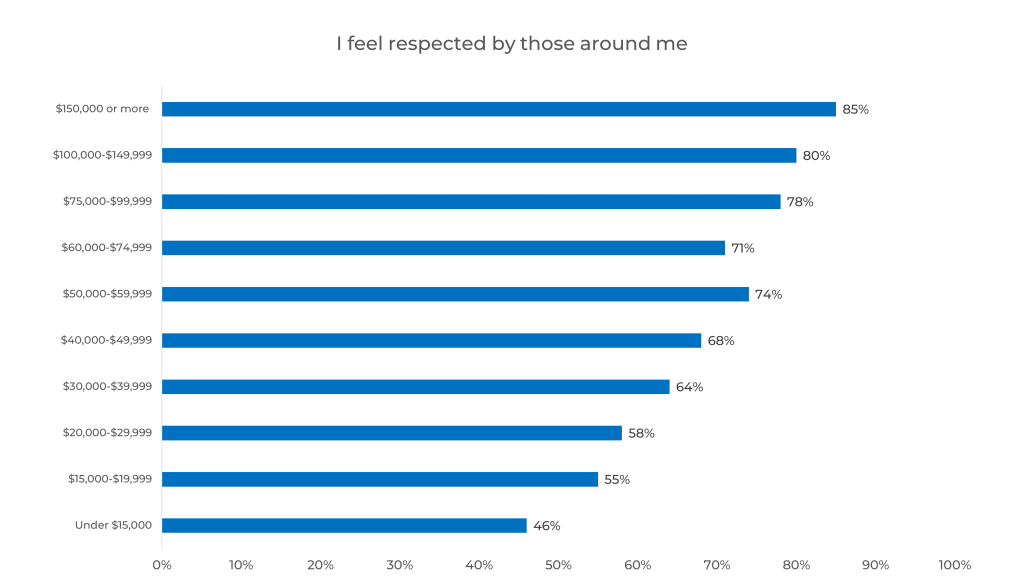
Furthermore, respondents are more likely to feel respected by those around them if they have a higher income.
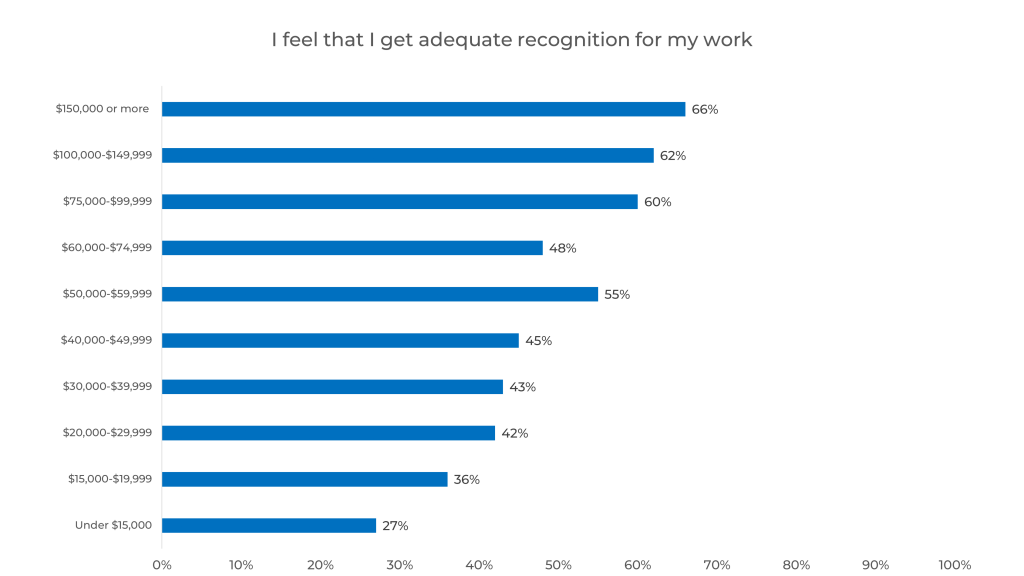
Finally, respondents with higher incomes are also more likely to feel that they get adequate recognition for their work.
Ethnicity
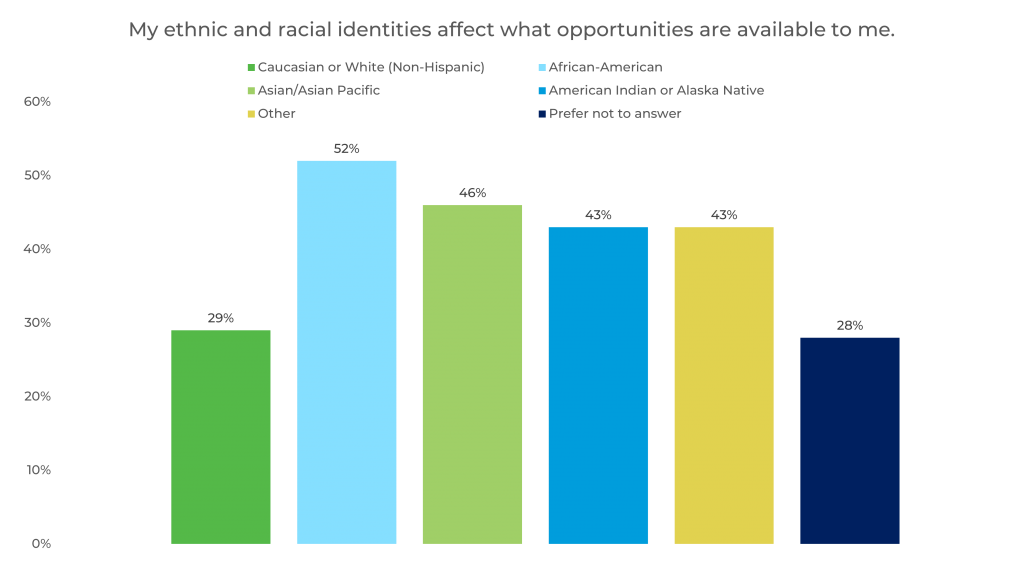
We also looked at response by ethnicity and saw significant differences among each group. Overall, we saw that 34% of respondents believe their ethnic and racial identities affect the opportunities available to them. Here, we see that Caucasian or White (Non-Hispanic) respondents and respondents who preferred not to answer are the only groups who responded below average as to whether their ethnic and racial identities affect the opportunities available to them. However, African-American respondents were 18% more likely to agree with this statement than the average respondent.
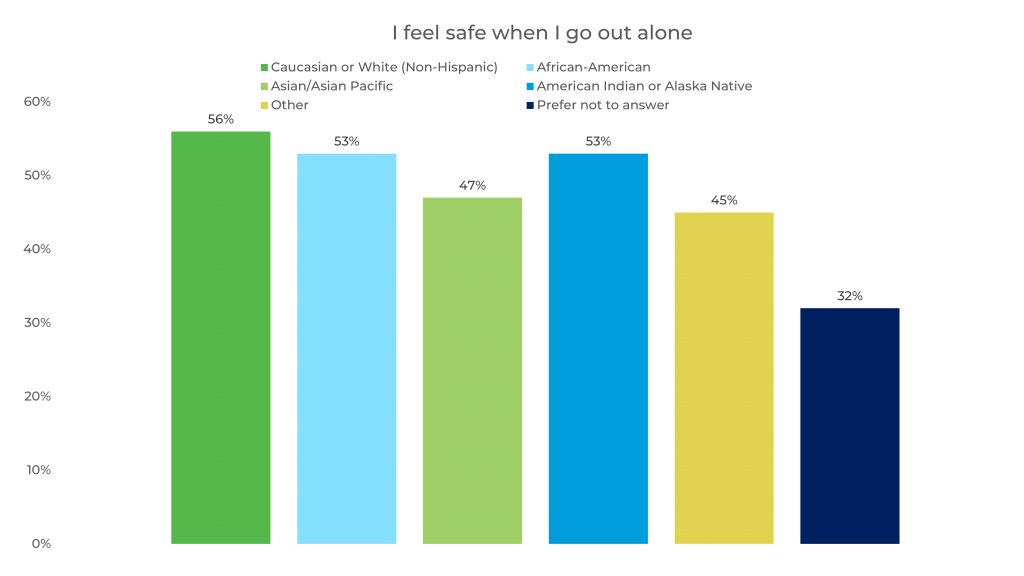
When asked whether they feel safe going out alone, Caucasian or White (Non-Hispanic) respondents were the only group to respond above average. Asian/Asian Pacific respondents were 7% less likely than the average respondent to feel safe when going out alone.
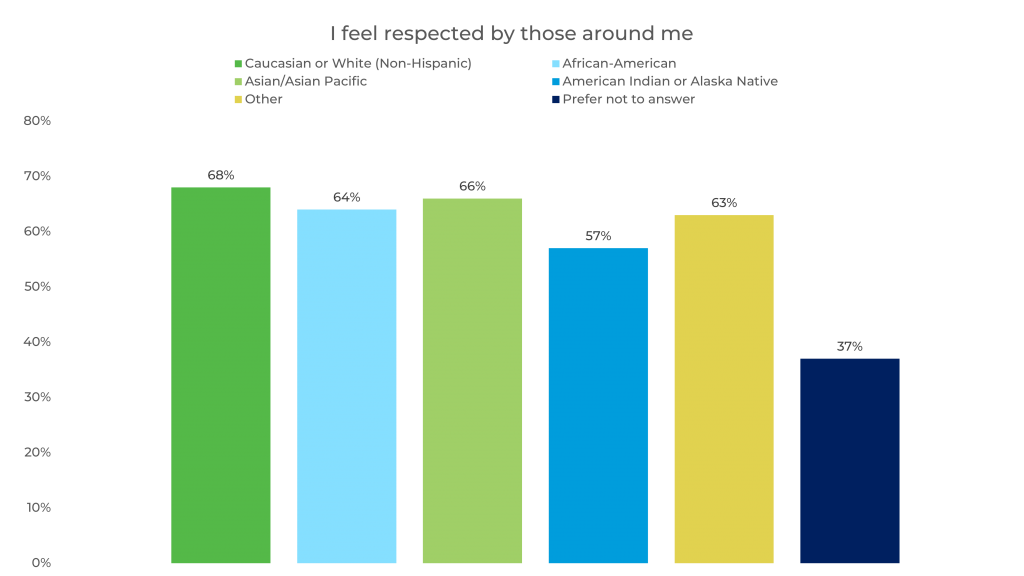
Caucasian or White (Non-Hispanic) and Asian/Asian Pacific respondents were most likely to feel respected by those around them and responded above the average respondent, while American Indian or Alaskan Native respondents were 9% less likely to feel respected by those around them than the average respondent.
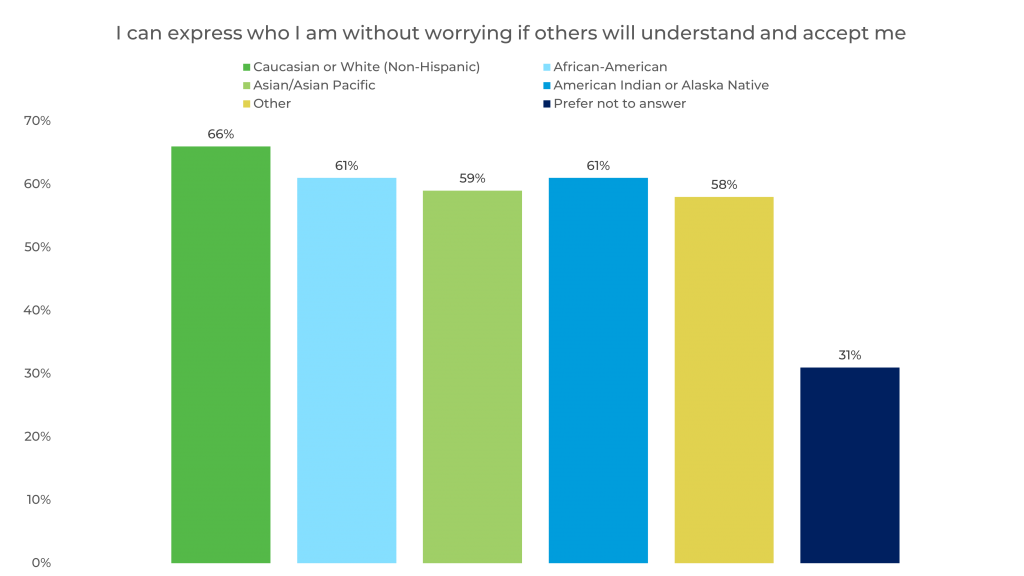
Caucasian or White (Non-Hispanic) respondents were the only group to respond above average as to whether they feel they can express themselves without worrying if others will understand and accept them.
As we continue to have conversations and implement new initiatives into our industry, it is important for us to continue to educate ourselves on diversity, equity, and inclusion. As an industry that strives to be as representative as possible in our research, it’s critical that we strive to do the same in our workplaces.
To learn more about Diversity and Inclusion in the workplace, check out our blog with last year’s findings from our research-on-research:
Diversity and Inclusion in the Workplace
To learn more about our research-on-research, download your copy of The Sample Landscape!