
Intellicast S4E20: Data Quality Trends and MR Acquisitions
June 8, 2021
COVID-19 and The Return to Normalcy
June 15, 2021
Diversity in the workplace is an ever-growing and important topic of conversation for our companies and has become even more prominent in the last year. In our latest round of research-on-research, we explored diversity and inclusion in relation to gender, income, and ethnicity.
Overall
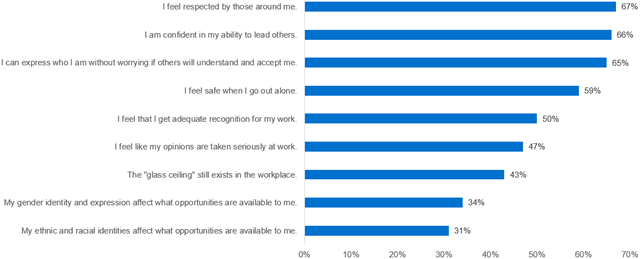
The majority of respondents agreed that they felt respected by those around them, confident in their ability to lead others, comfortable expressing who they are, and safe when going out alone.
34% of respondents believe that their gender identities/expressions affect what opportunities are available to them, and 31% of respondents believe that their ethnic/racial identities affect what opportunities are available to them.
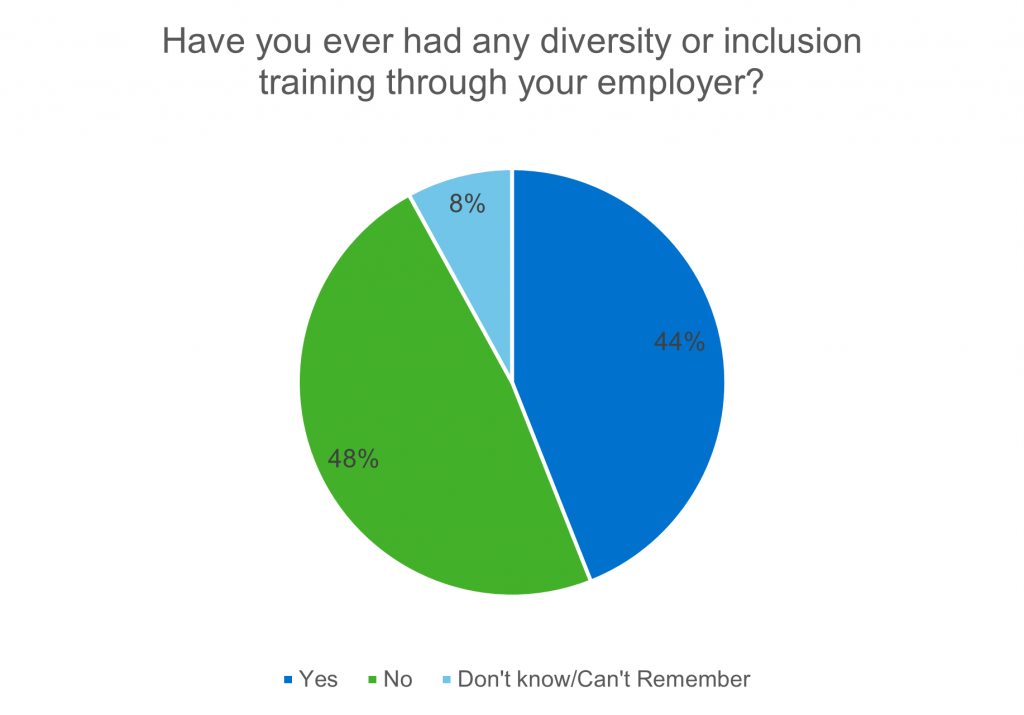
Respondents were also asked whether they have received diversity and inclusion-related training at work. Of those currently employed, only 44% of respondents recalled receiving diversity or inclusion training through their employer.
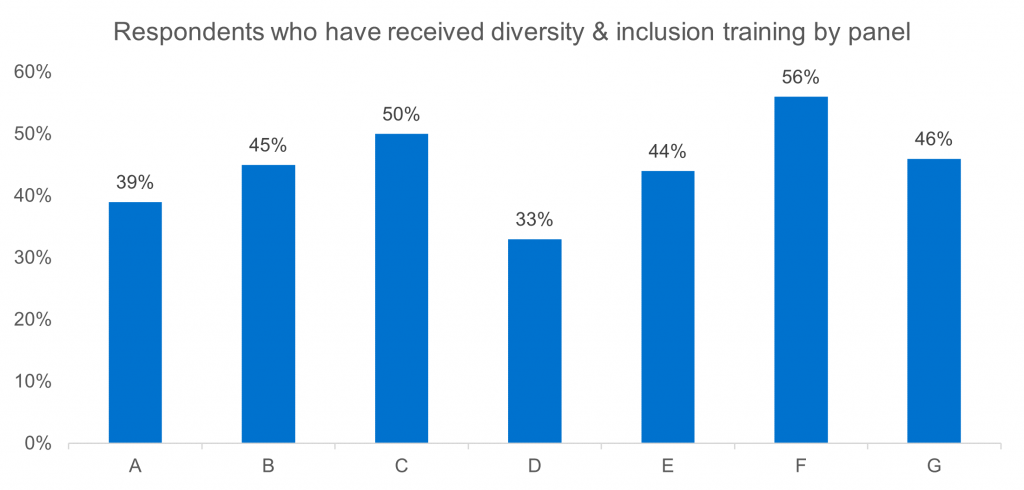
When isolated by panel, however, there are some significant differences. For example, there is a 23% difference between panels F and D in the proportion of respondents who have received diversity & inclusion training through their employer.
Gender
In our research-on-research, we tried out multiple methods of asking gender in order to see what feels most inclusive to respondents and to give them a more positive survey experience. Along with male and female options, respondents were able to note if they did not identify as either male or female, or if they preferred not to provide an answer. Respondents were also provided the ability to note if they were transgender, questioning, or a variety of other options. Due to small sample sizes of respondents who chose these options, we will focus on respondents who identify as male or female for the purpose of comparisons within this study.
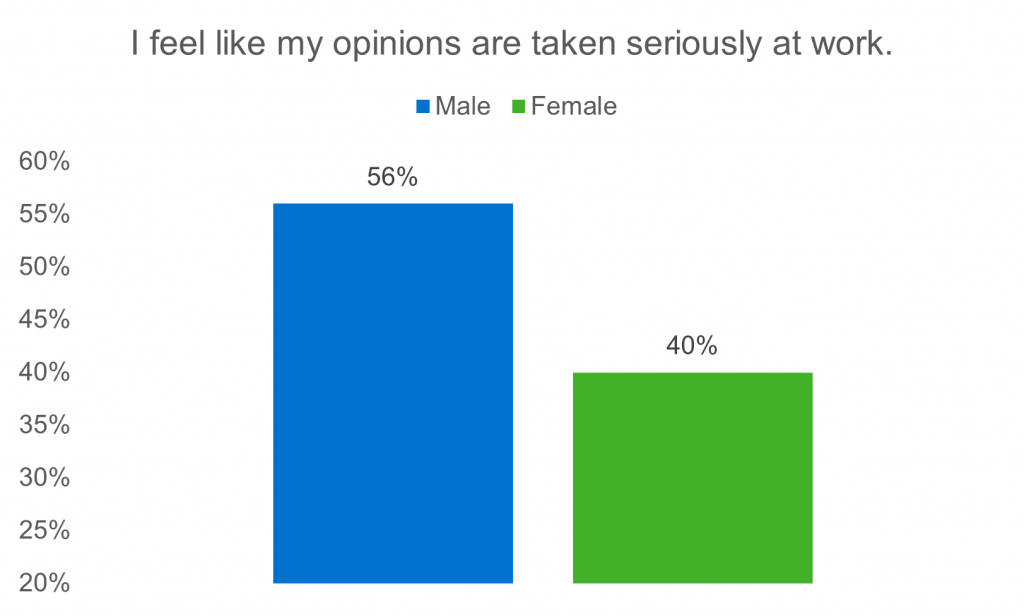
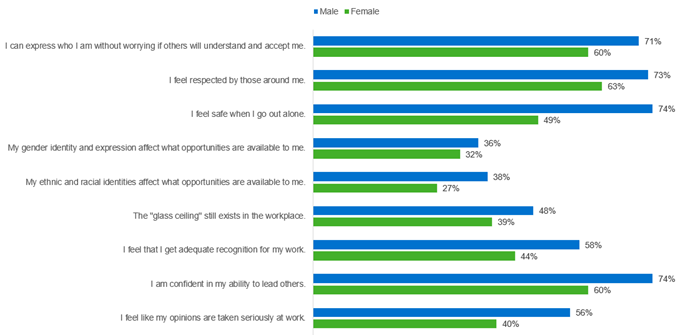
When segmented by male and female, there are some significant differences in the proportions of respondents who agree with different statements. For example, female respondents are 16% less likely than male respondents to feel that their opinions are taken seriously at work.
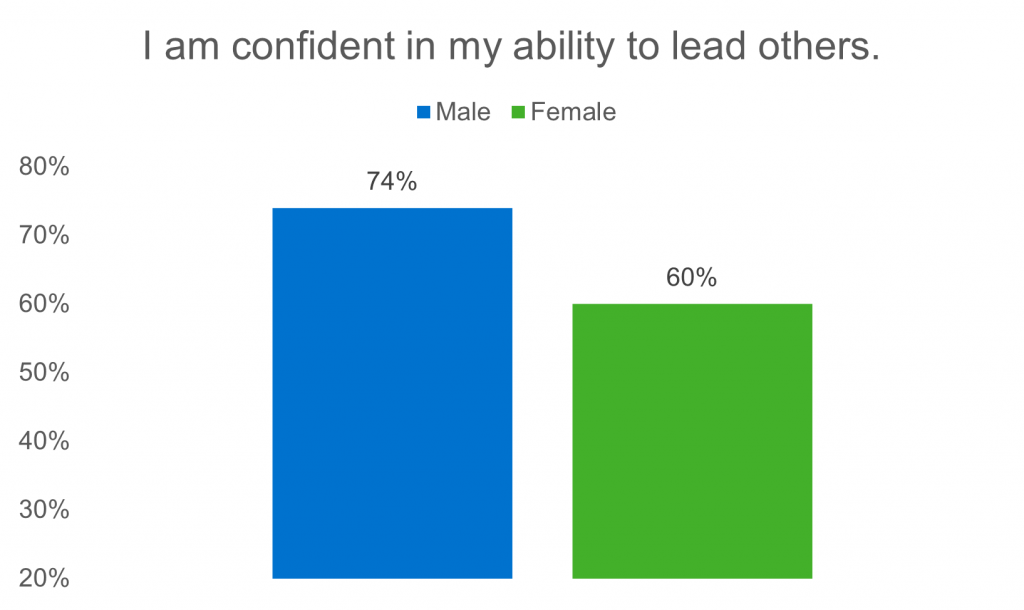
Female respondents were also 14% less likely than male respondents to feel confident in their ability to lead others.
Additionally, a 25% difference was seen in the amount of male and female respondents who feel safe when going out alone.
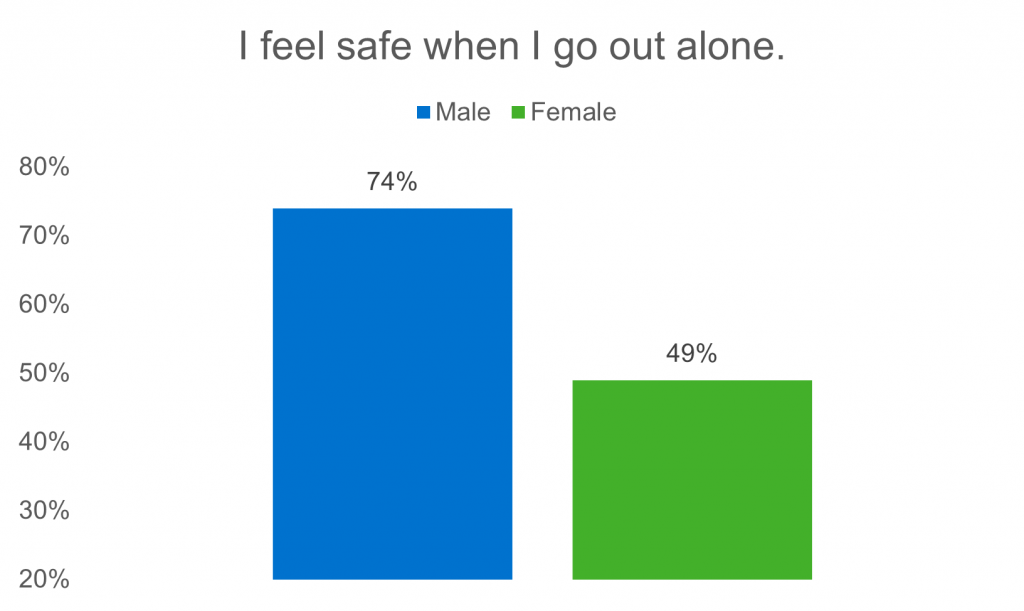
Ratings for all statements segmented by gender are shown below.
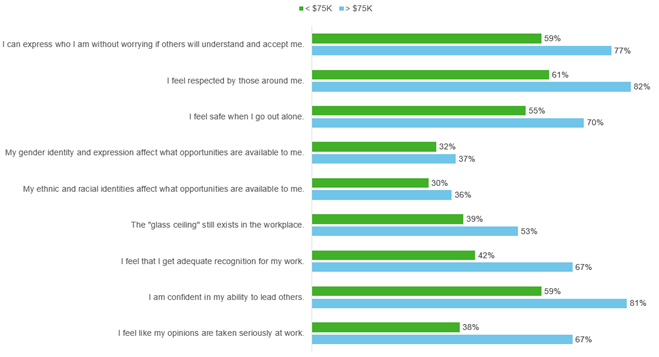
Income
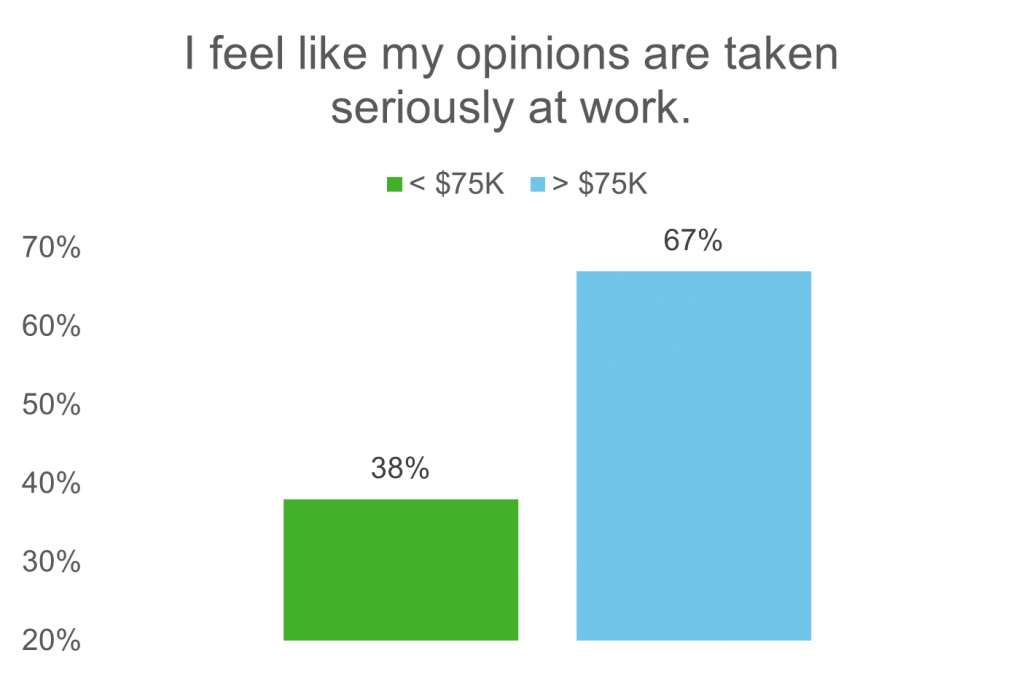
Differences also exist between respondents of varying income. Respondents were segmented into two groups – those earning less than $75,000 annually and those earning greater than $75,000 annually. When asked whether they feel their opinions are taken seriously at work, the different income groups saw a 29% difference.
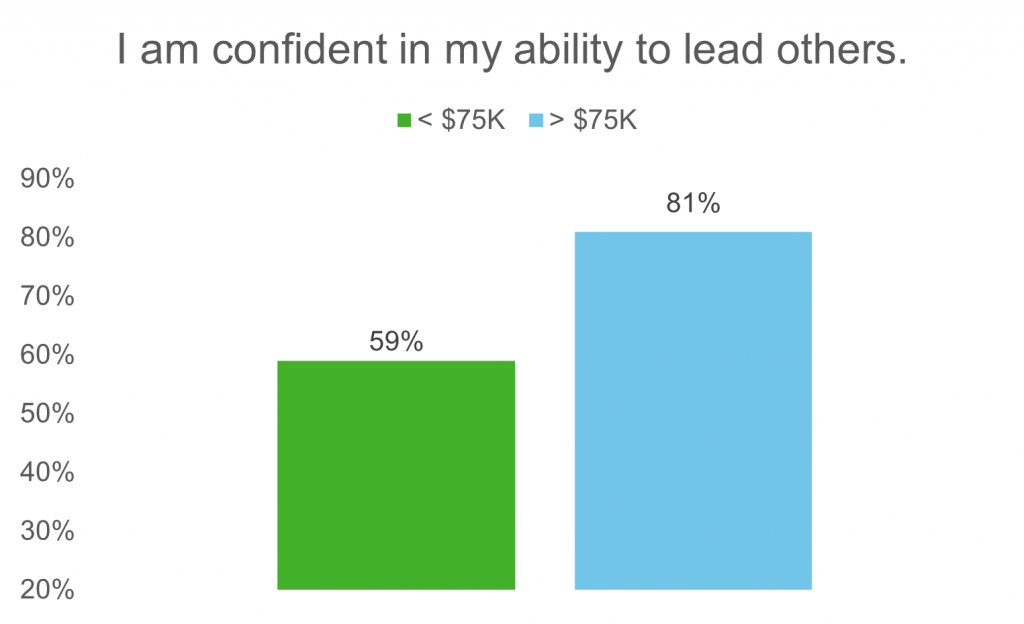
Those earning less than $75,000 annually were also 22% less likely to be confident in their leadership abilities than those earning more.
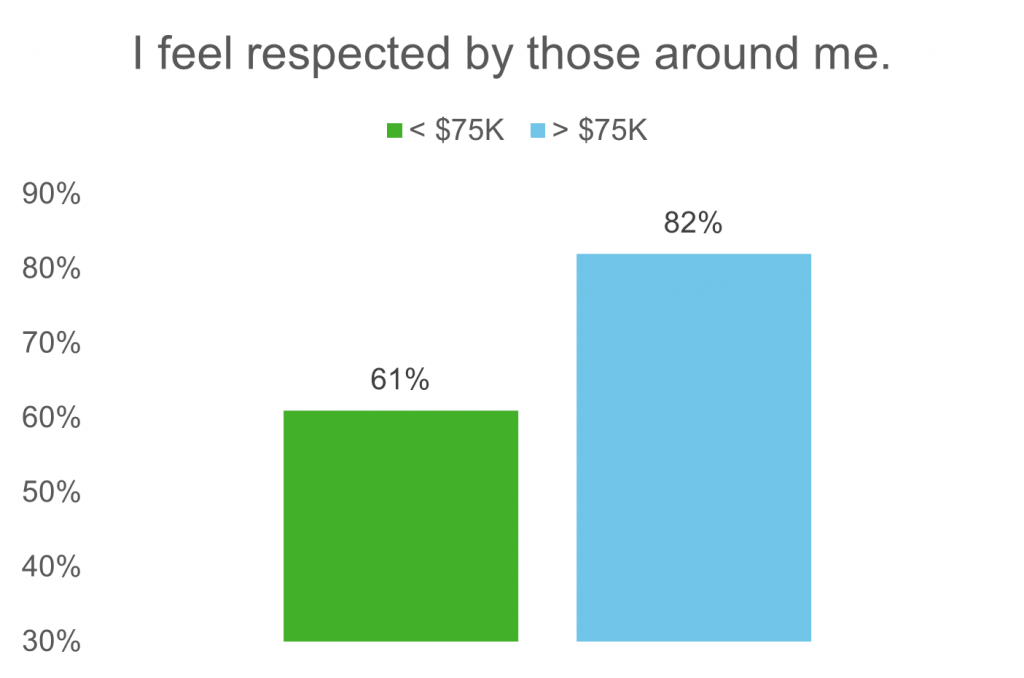
Furthermore, there was a 21% difference between income groups in their likelihood to feel respected by those around them.
Finally, those earning less than $75,000 annually were 25% less likely to feel that they get adequate recognition for their work than those earning more.
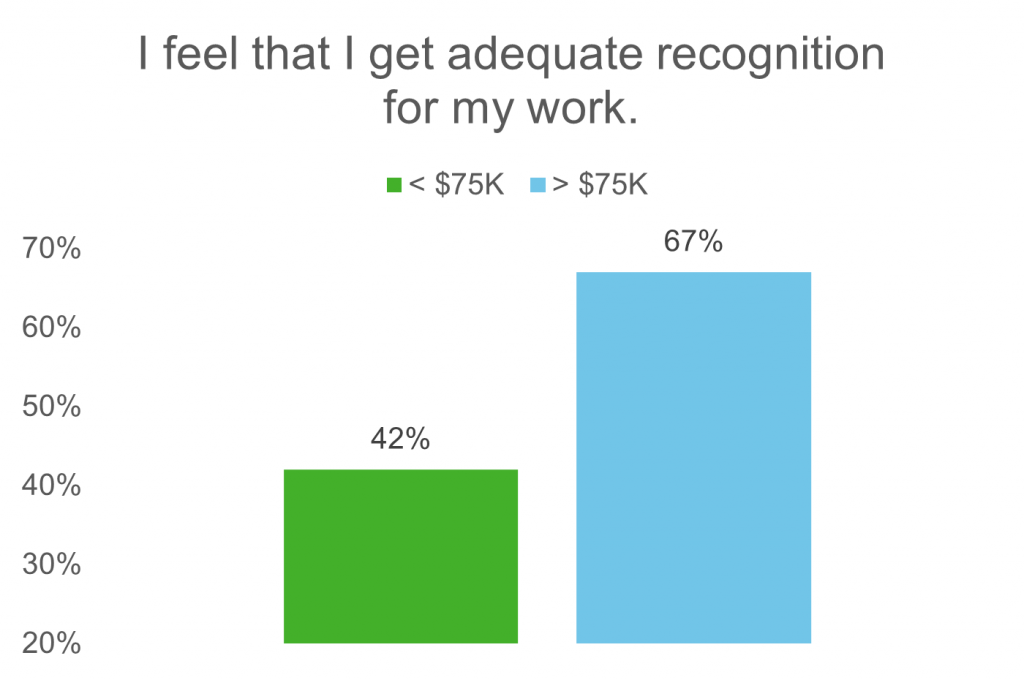
Ratings for all statements segmented by income are shown below.
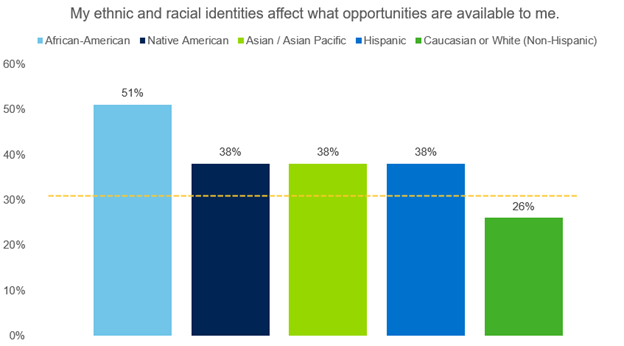
Ethnicity
Respondents were also segmented by which ethnicity they most closely identify with, and significant differences can be seen among ethnic groups. Overall, we saw that 31% of respondents believe that their ethnic/racial identities affect what opportunities are available to them, which is represented by the dashed line in the graph below. We see that Caucasian or White (Non-Hispanic) respondents were the only group who responded below average to whether their ethnic and racial identities affect what opportunities are available to them. Meanwhile, African-American respondents were 20% more likely to agree with this statement than the average respondent.
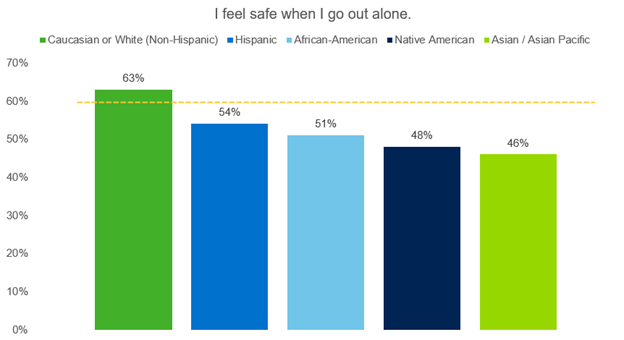
When respondents were asked whether they feel safe when going out alone, Caucasian or White (Non-Hispanic) respondents rated above average, while Asian/Asian Pacific respondents were 13% less likely than the average respondent to feel safe when going out alone.
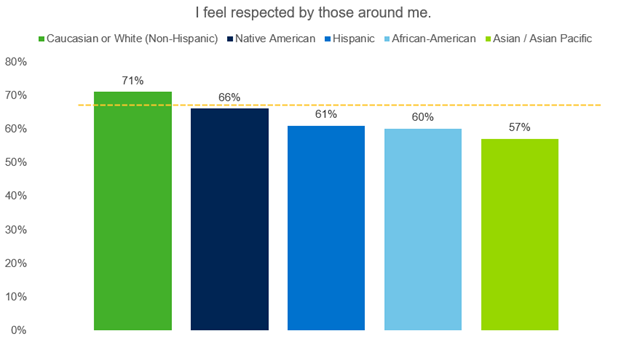
When respondents were asked whether they feel respected by those around them, we saw that Caucasian or White (Non-Hispanic) respondents again rated above average. Native American respondents were the second most likely group to feel respected by those around them at 66%. Asian/Asian Pacific respondents were the least likely to agree with this statement at 57%.
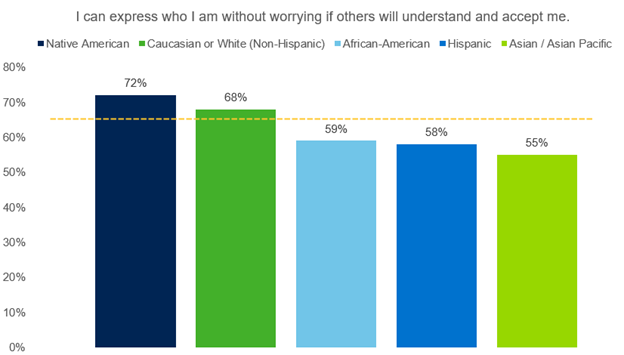
Both Native American and Caucasian or White (Non-Hispanic) respondents agreed that they can express who they are without worrying about being understood or accepted more than the average respondent. Asian/Asian Pacific respondents were the least likely to agree with this statement at 55%.
As market researchers, it is important for us to build diverse cultures in our workspaces and educate ourselves about diversity and inclusion. At the heart of what we do is a responsibility for understanding the consumer behavior of highly diverse populations —something we can’t do if our leaders and decision-makers are not ultimately being diverse.
To learn more about diversity and inclusion, check out the following episodes of Intellicast where we’ve had great conversations surrounding diversity in the workplace:
S4E18—Building a Diversity and Inclusion Team


