
Intellicast S4E25 – Ownership Changes, Tangents, and Polling Talk
July 26, 2021Intellicast S4E26 – Olympics and a SampleCon 2021 Recap
August 3, 2021
Respondent experience should be top of mind when thinking about survey design. The way respondents access surveys is constantly evolving and we must be able to adapt.
The number of respondents who prefer to take surveys on their smartphone has been increasing. One of the ways that we can analyze this shift to mobile devices is by demographic. In this blog, we look at smartphone preference by gender, income, and ethnicity.
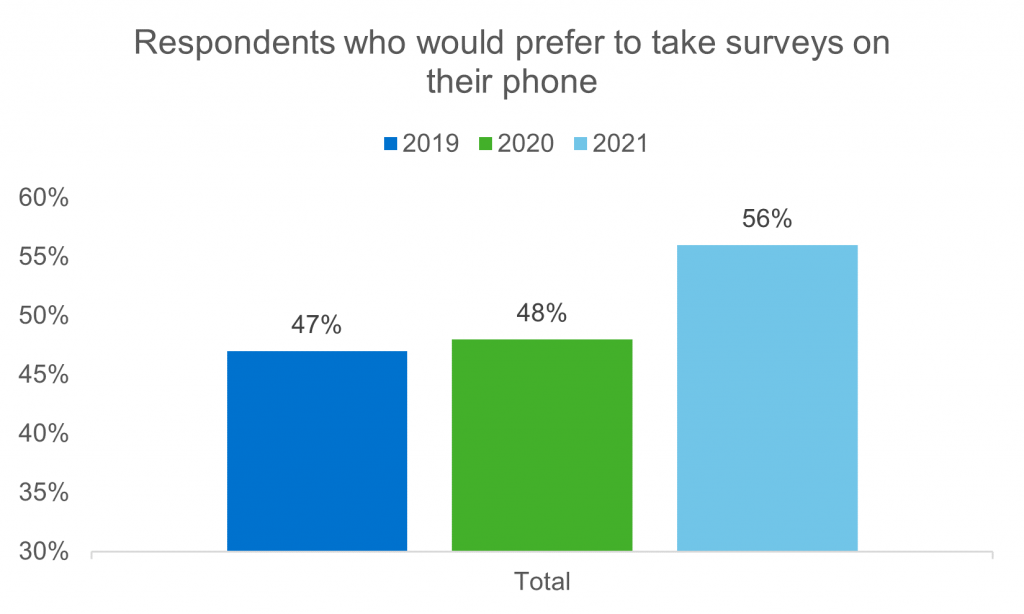
Overall Device Performance
From 2019 to 2021, overall preference to take surveys on phones has increased significantly with a 9% change.
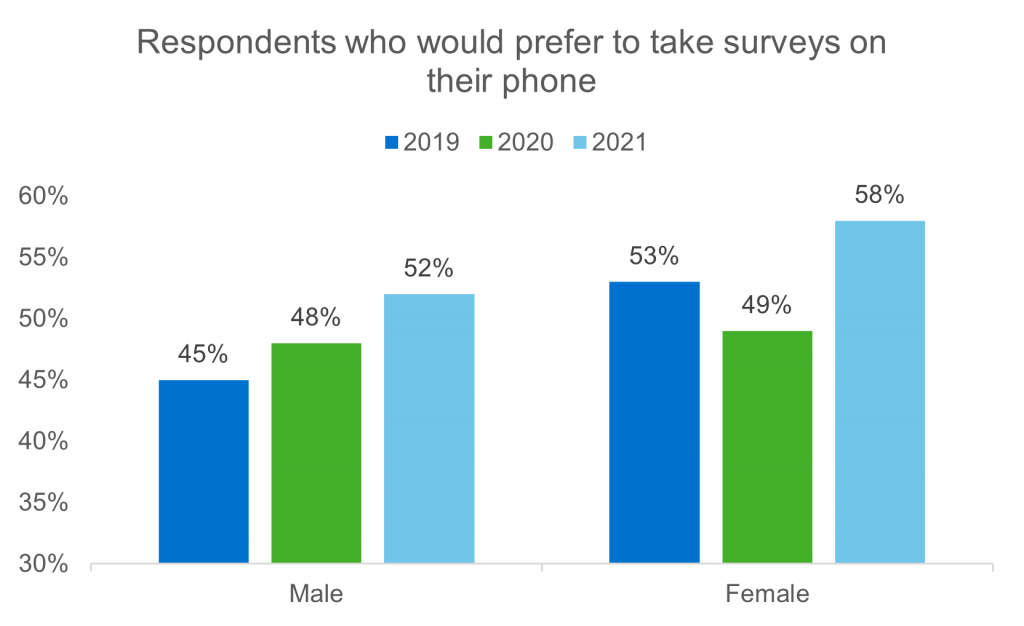
We examine device preference more closely by looking at different demographics. For example, females are consistently more likely than males to prefer to take surveys on their phone. From 2020 to 2021, the proportion of females who prefer to take surveys on their phone grew by 9%.
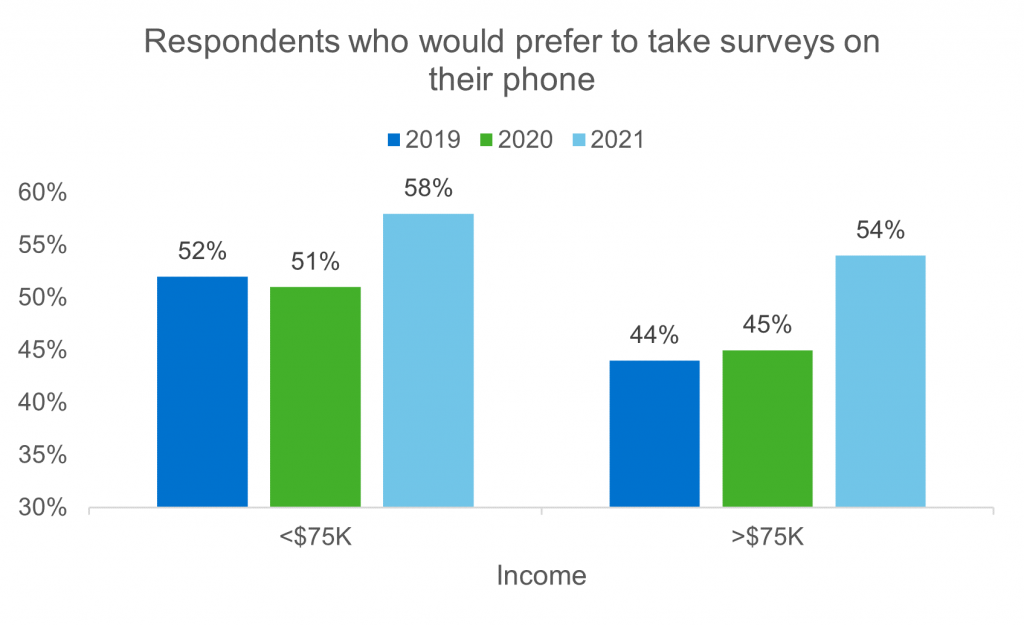
We also see that respondents with annual incomes less than $75,000 are consistently more likely than others to prefer to take surveys from their phone, although higher income respondents have seen a 9% increase in the past year.
One important way to analyze device usage is by ethnicity. When we segment respondents in this way, it is clear that respondents of different ethnicities have different preferences when it comes to taking surveys. While every group has experienced an increase in preference for taking surveys using their phones in the past year, we see that African American and Hispanic respondents tend to prefer taking surveys on their phones more than others.
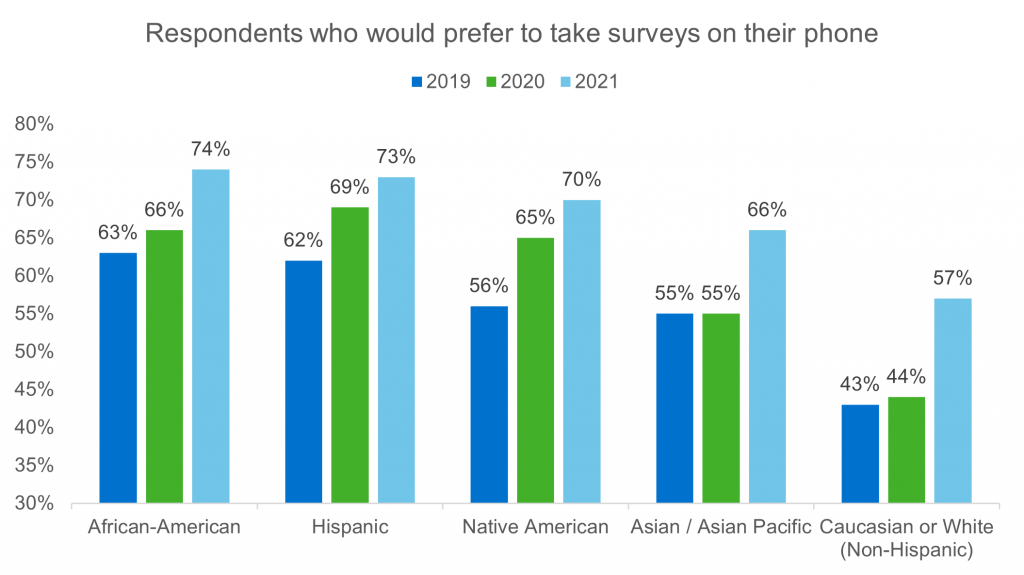
Understanding these differences among ethnicities is critical for survey design and ensuring that respondents of all ethnicities are given a positive and user-friendly experience.
Respondent Ethnicity and the Trend Toward Mobile Devices
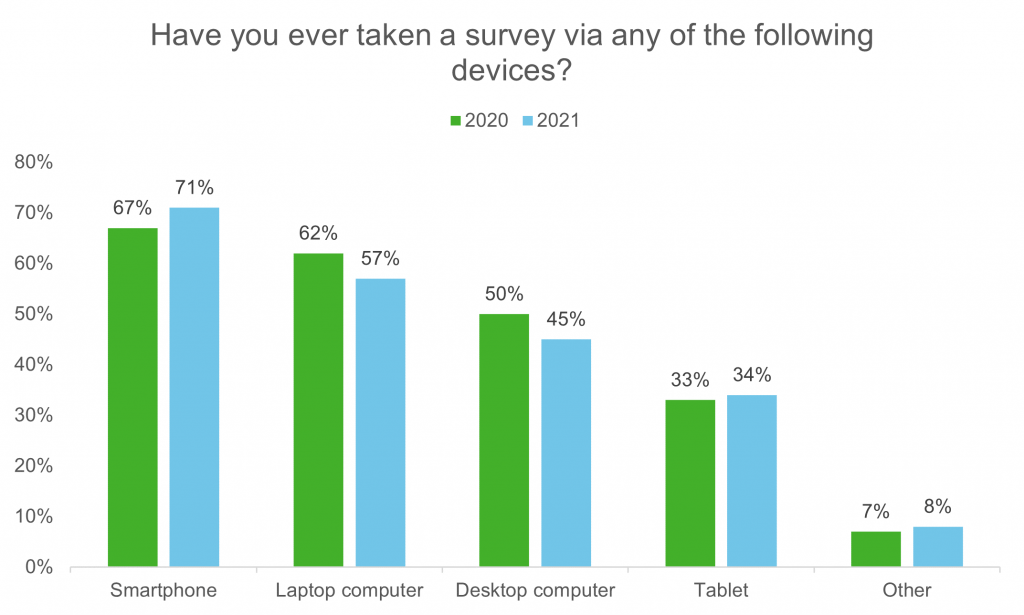
From 2020 to 2021, the overall proportion of respondents who have taken surveys on mobile devices such as smartphones and tablets has increased, whereas the proportion who have taken surveys on laptop and desktop computers has decreased. This indicates a trend toward survey taking via mobile device.
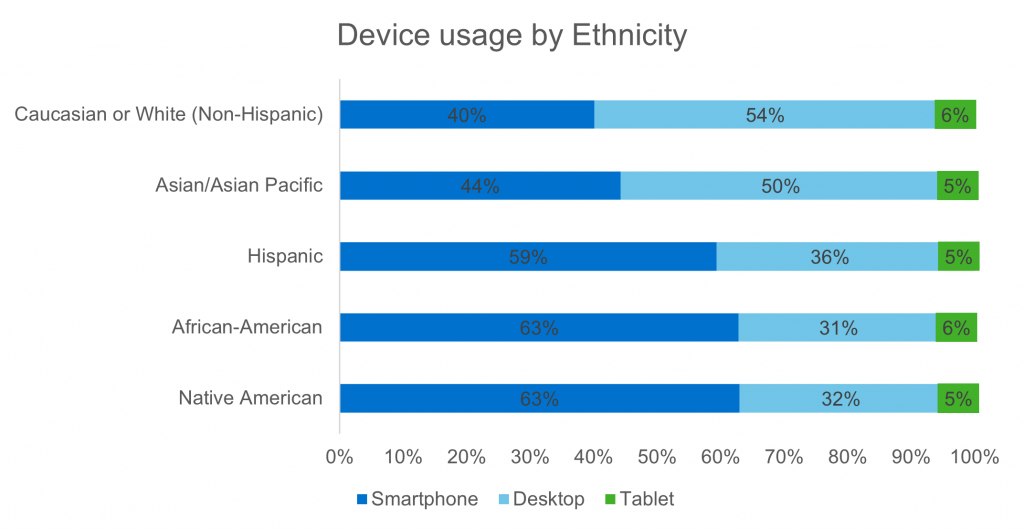
However, this trend in device usage varies greatly by ethnicity. Caucasian or White (Non-Hispanic) respondents are actually still more likely to use a desktop to take surveys than a mobile device. On the other hand, Hispanic, African American, and Native American respondents are much more likely to use a smartphone. 69% of African Americans use mobile devices (either a smartphone or tablet) to take surveys.
The growing focus on ensuring that we have diversity within our studies means that making our surveys smartphone friendly is more important than ever. As we see here, device preference changes greatly by demographic with a trend toward preference for smartphones. However, the disparities among device usage by ethnicity is even greater. In order to create the most user-friendly experience for all respondents, we must make our surveys device agnostic.
To learn more about device usage and respondent experience, check out our recent blogs and resources:
Respondent Experience and How It Can Be Improved
Respondent Experience and How We Can Make it Better
Visual Presentation and its Impact on Respondent Experience and Data


