
Intellicast S3E31 – Data Quality with Terry Crawford of MMR
June 19, 2020Intellicast S3E32 – Talking Healthcare Research with Steve Barnard of The Link Group
June 23, 2020
Here at EMI, we understand the importance of respondent experience when taking online surveys. That’s why we took the time to ask respondents in our latest round of research what we can be doing to make their survey experience the best it can be.
Total
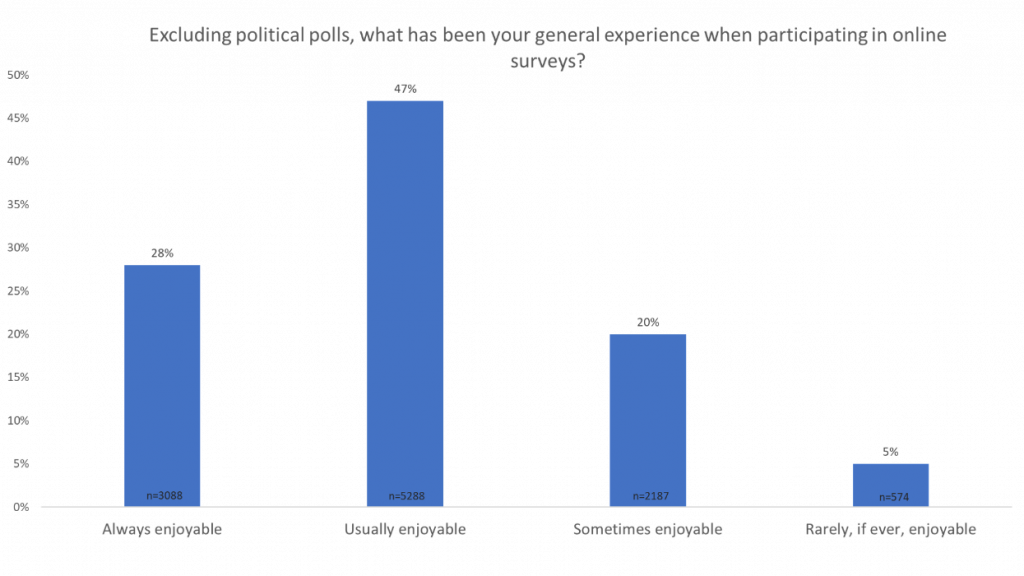
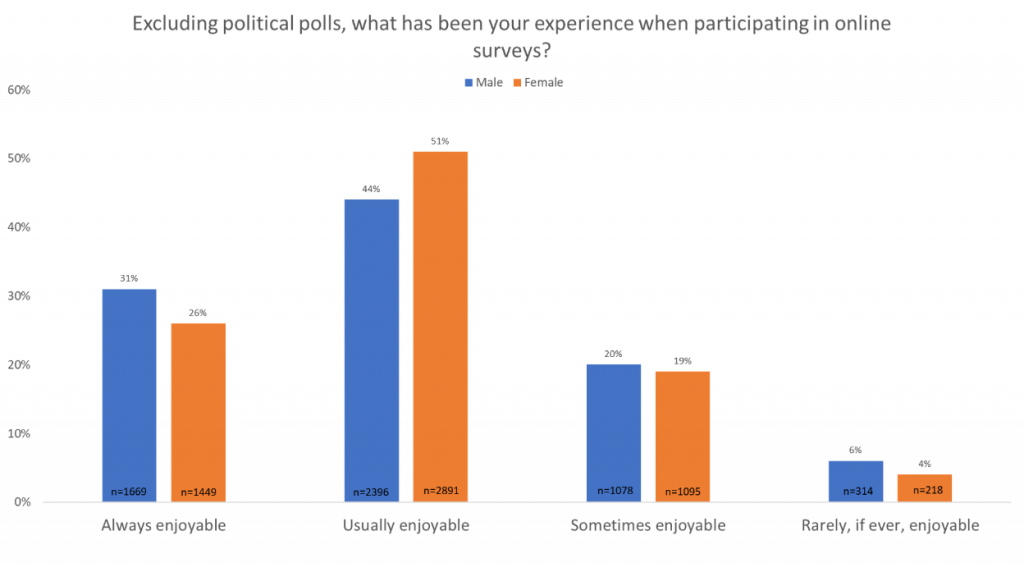
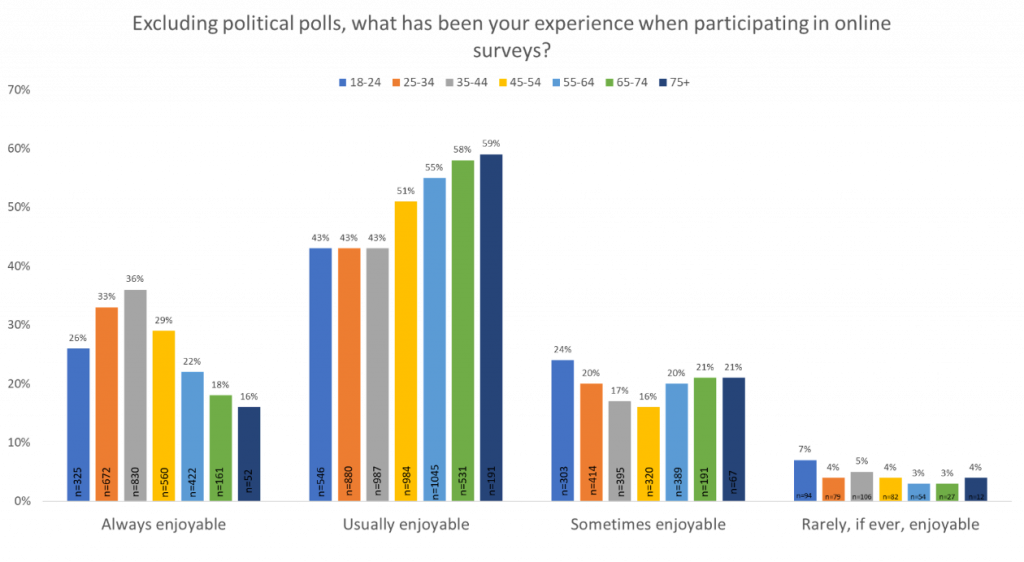
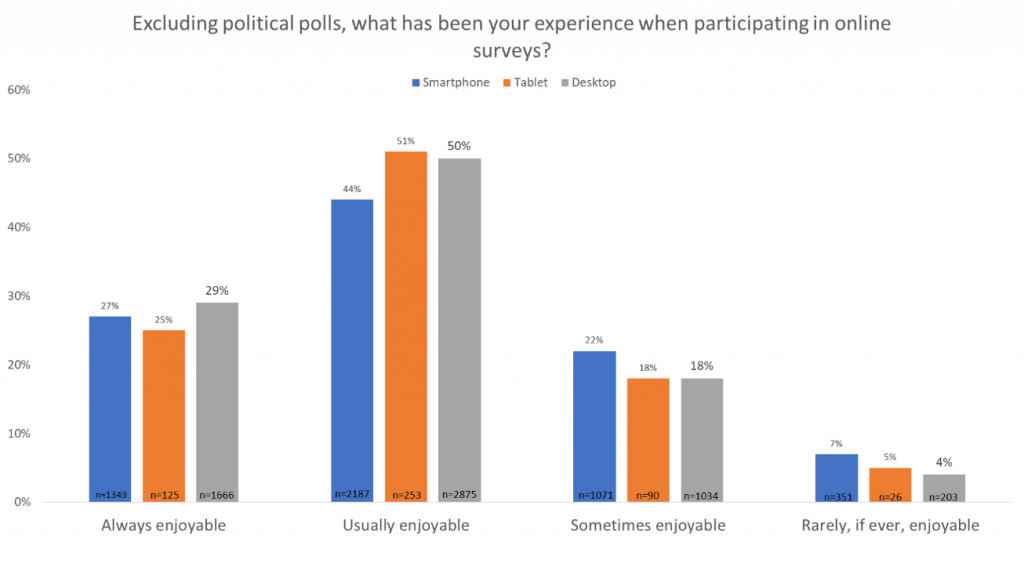
When looking at the data overall, we asked about the general experience of participating in online surveys. And, 5% of respondents said their survey experience is rarely, if ever, enjoyable.
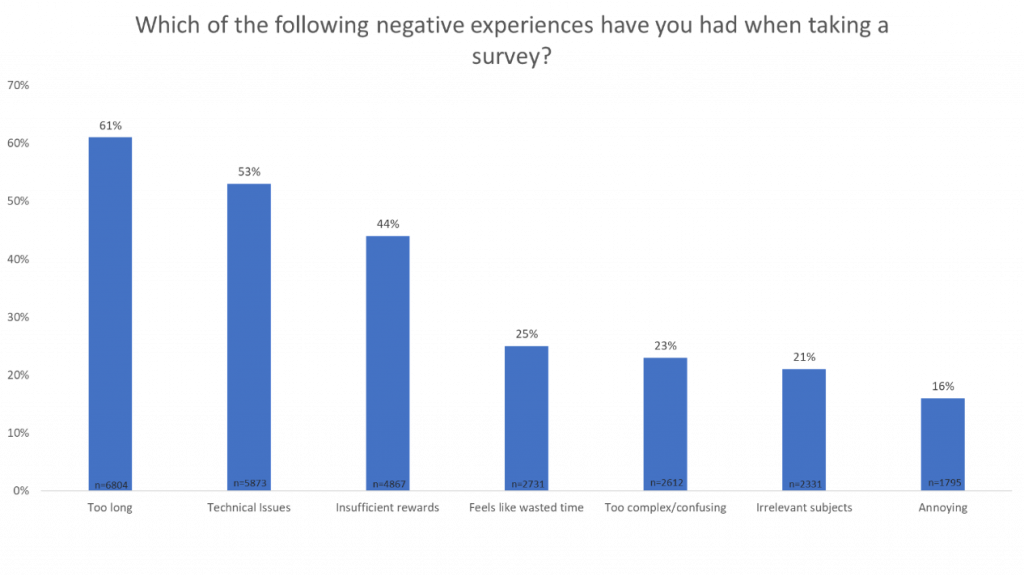
We also asked respondents about the negative experiences they have encountered. The most common negative experience is that surveys take too long. This is followed by technical issues. The next most common is insufficient rewards, followed by surveys feeling like wasted time and finding surveys too complex/confusing. The last two are feeling that surveys cover irrelevant subjects, followed by finding surveys to be annoying.
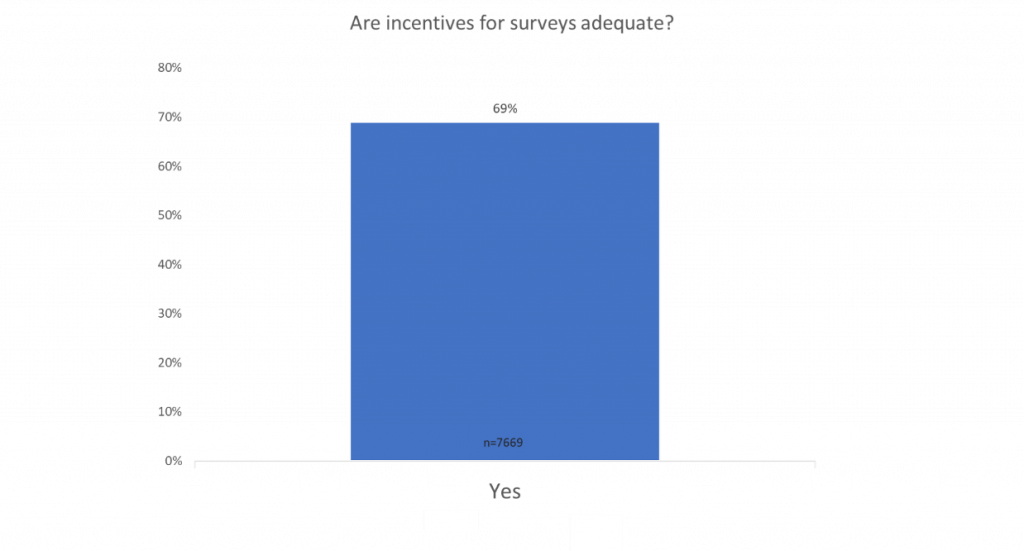
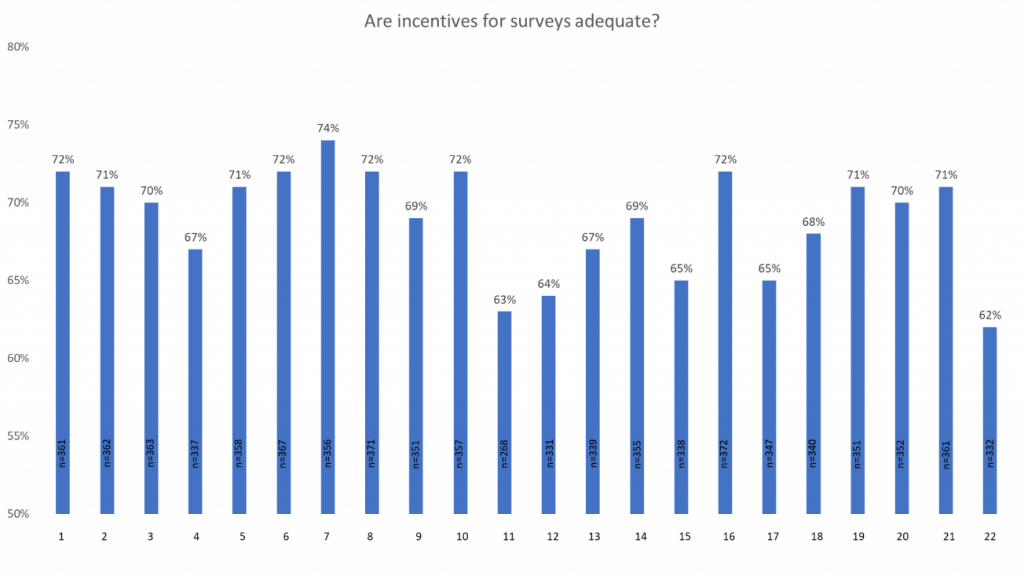
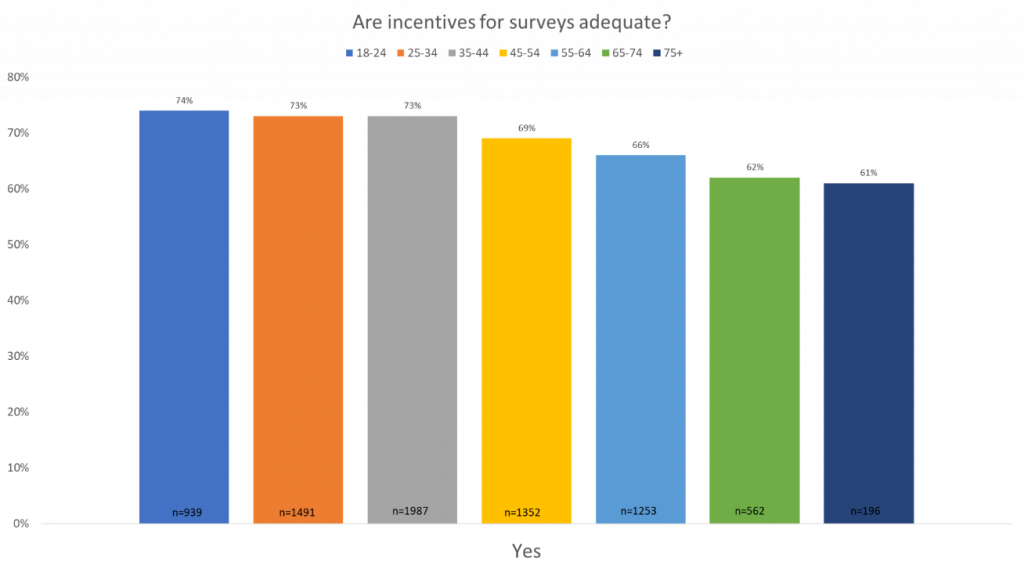
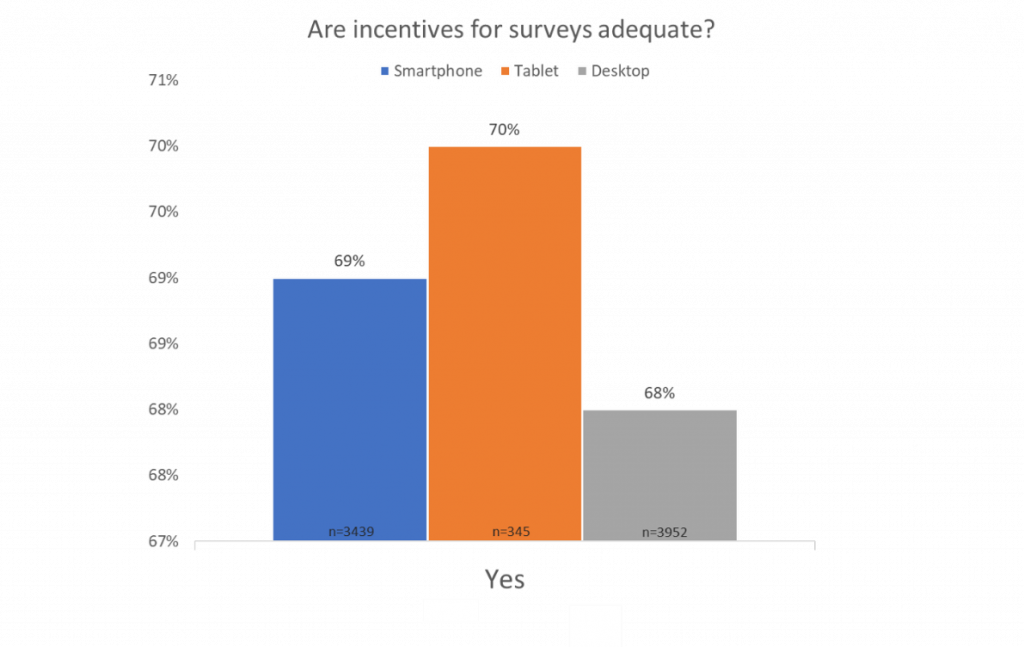
Another aspect that our research looked at is incentives – we found that 69% of respondents overall feel that incentives for surveys are accurate.
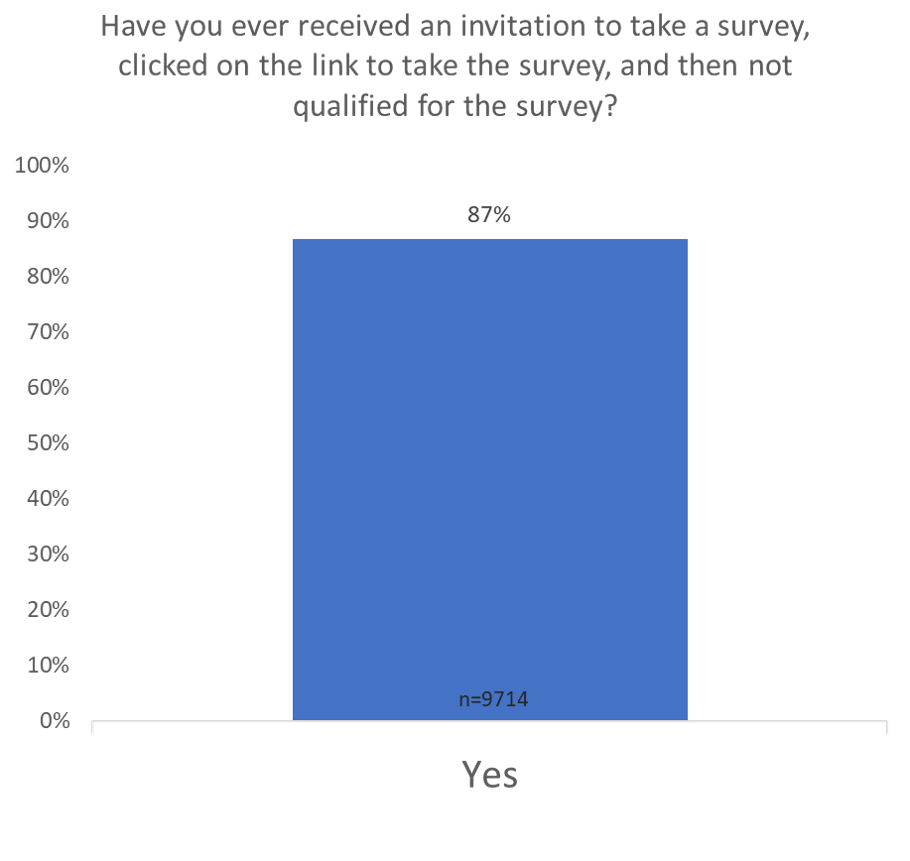
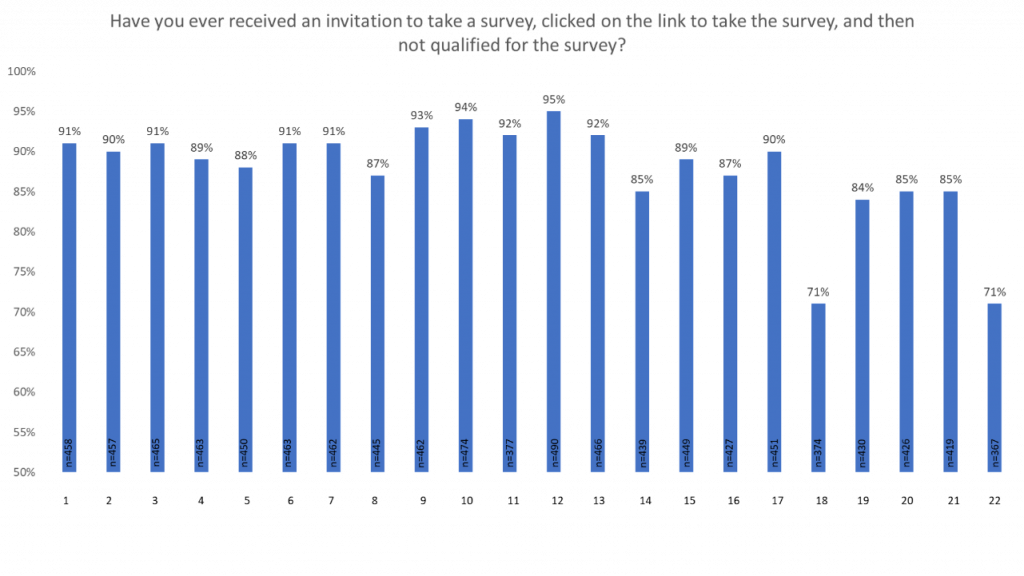
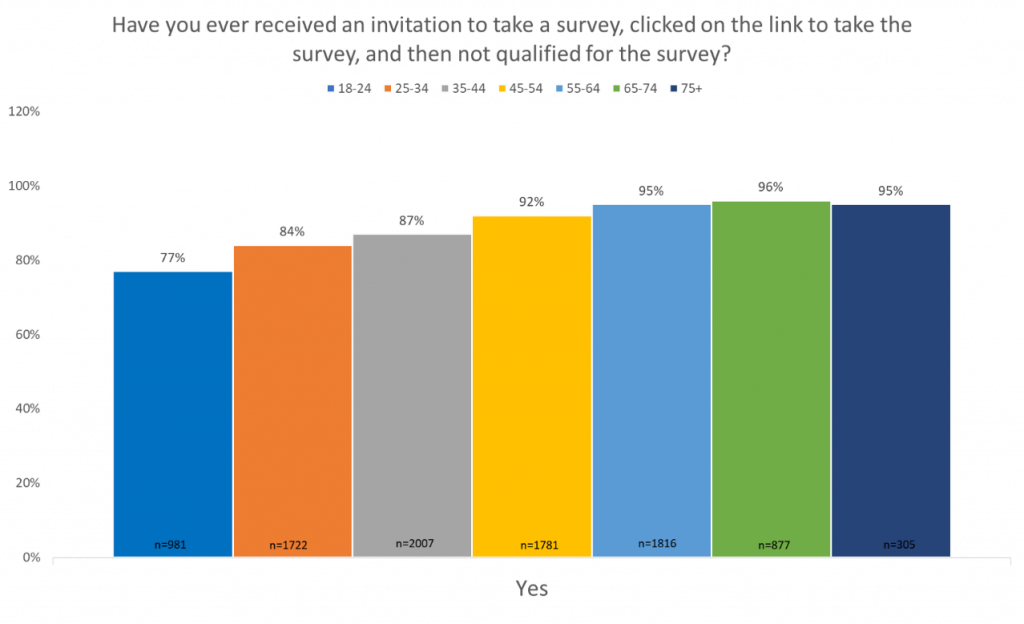
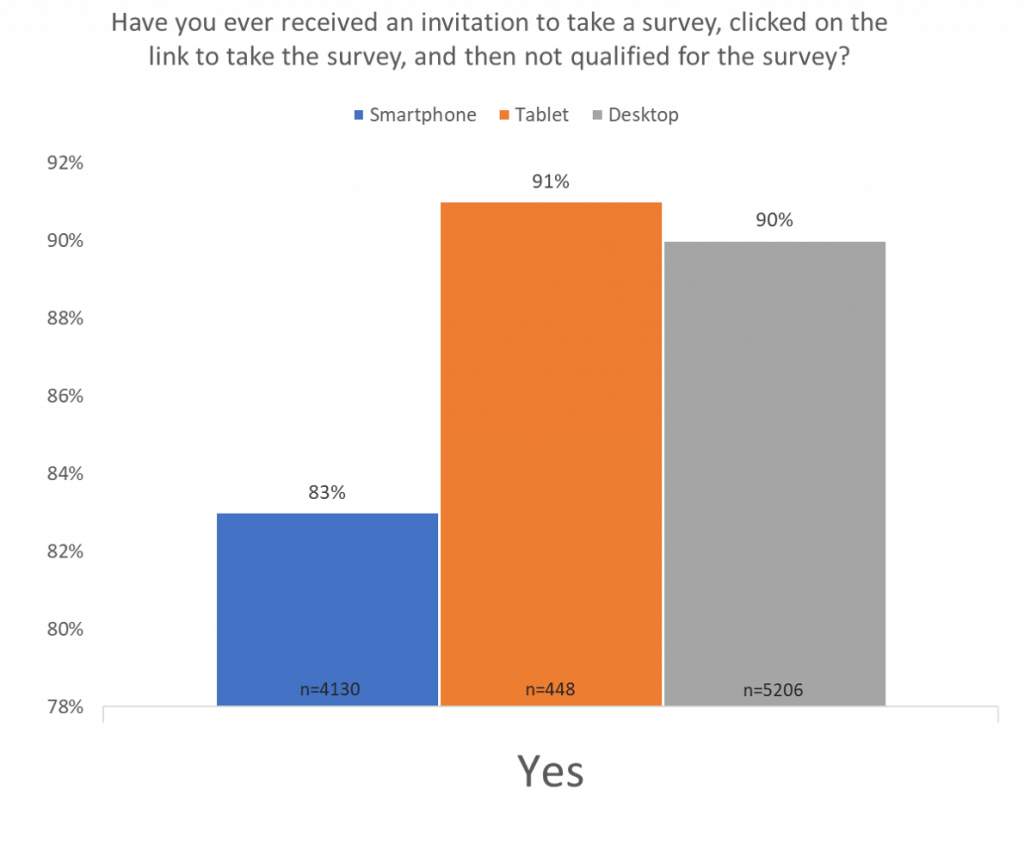
Not qualifying for surveys was another common negative experience among respondents where 87% of respondents said they have clicked on the link to take a survey and later found out that they didn’t qualify.
Now, we will take a look at our respondent experience by panel, age, gender, and device usage. Within these demographics, we found that male respondents, respondents from panels 18 and 22, respondents ages 18-24, and respondents using a smartphone have the least enjoyable survey experience.
Panel
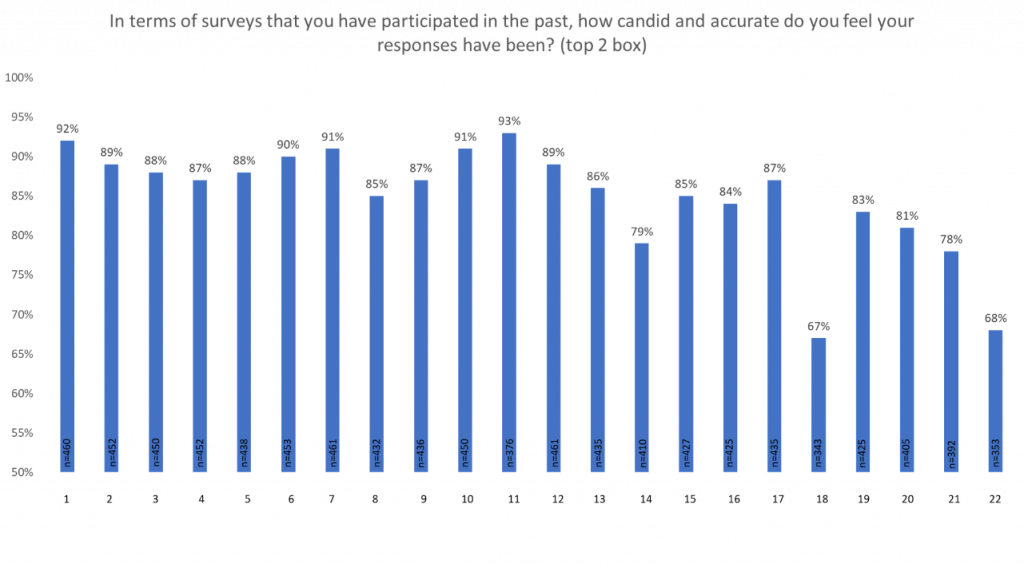
When looking at our respondents by panel, we found that panels 18 and 22 report being the least candid in their response. This is interesting considering they are the two panels that find surveys least enjoyable.
“Na” “Coop.” “Idk.” “n/a” Meh.” “Is it over?”
Panels 18 and 22 are also the panels that most reported not qualifying for surveys, which could be another reason why they find surveys unenjoyable.
“To qualify for all of them and not get rejected or start one and get kicked out in the middle.”
“Sincere qualifications system for surveys.”
Panels 11 and 22 most reported that the incentives for taking surveys are not accurate.
“Better incentives.”
“Higher value of compensation.”
“More gift card incentive.”
“Better pay if you qualify or not.”
“Better monetary rewards and easier cashing out.”
Gender
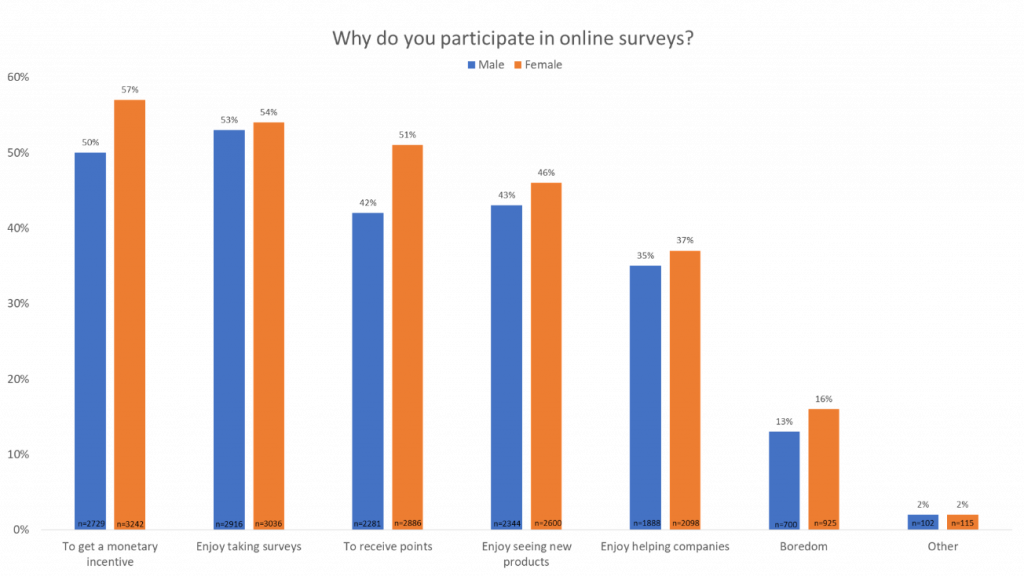
When looking at the data by gender, we found that males generally find surveys less enjoyable than females.
Male: “Greater enjoyment of doing a survey;” “Include various subjects of surveys, make them enjoyable to take.”
Female: “I love taking surveys. I enjoy them. It’s entertaining!”
“I enjoy almost all the surveys and take as many as I have time for. I try to take as many as I see.”
We also found that females participate in surveys more for monetary incentive, points, and out of boredom than males.
Female: “Incentives such as points toward a game, money, a free product.”
“Enough points on games to make it worth my time.”
“Be more optimistic about achievement and not failure. The coronavirus has me almost shut-in so I do it out of boredom basically.”
Age
When looking at respondents’ enjoyment of surveys by age, we found that respondents in the 18-24 age range find surveys least enjoyable. Respondents in the 45-54 age range find them most enjoyable.
18 y/o: “They have to be on subjects that are relevant to my life and my hobbies or at least have better incentives.”
18 y/o: “More interesting products that are useful.”
45 y/o: “Like everything about it.”
45 y/o: “I will be willing to take more surveys to help companies.”
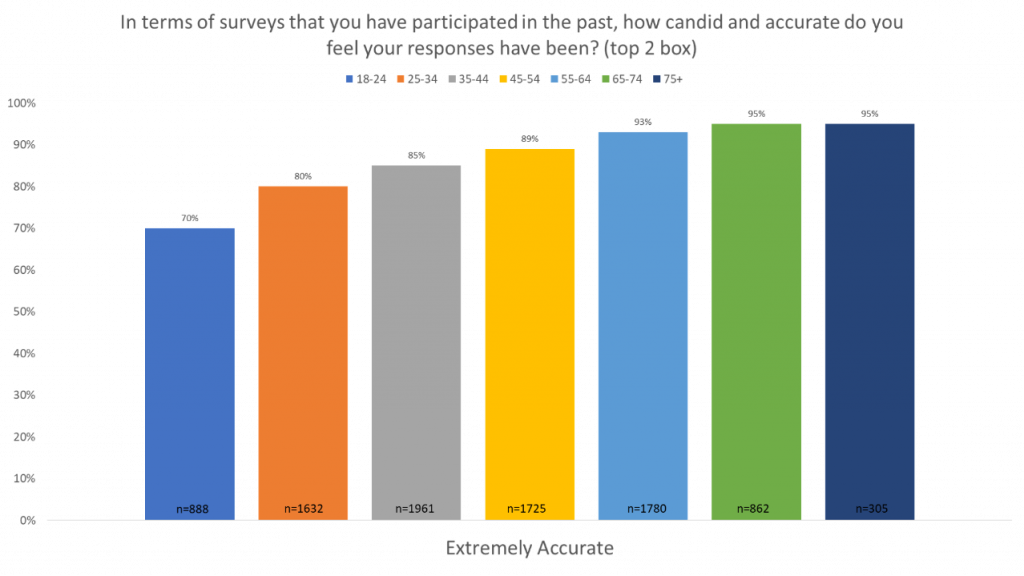
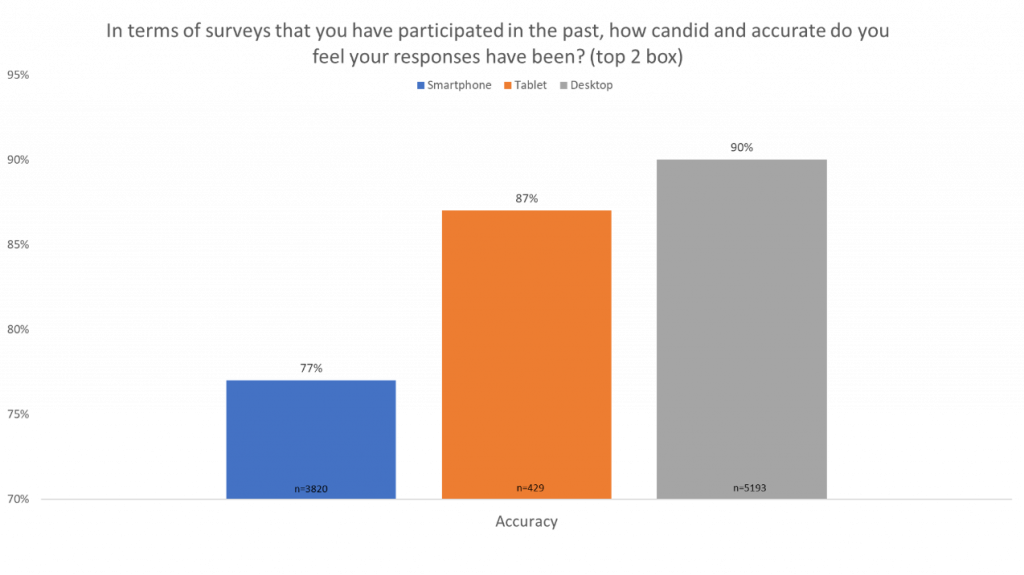
In general, the older a respondent is, the more likely they are to feel that their responses are more candid and accurate.
52 y/o: “I enjoy taking surveys. And am always honest in feedback.”
55 y/o: “I like taking surveys and more points would be nice since I answer honestly and take my time doing them.”
Additionally, the older a respondent is, the less likely they are going to feel that incentives for surveys are adequate.
67 y/o: “Larger incentive. 30 or 40 cents for 45 minutes of your time is not good.”
75 y/o: “I would probably take more surveys if the incentive was better. Incentives have been decreasing for several years.”
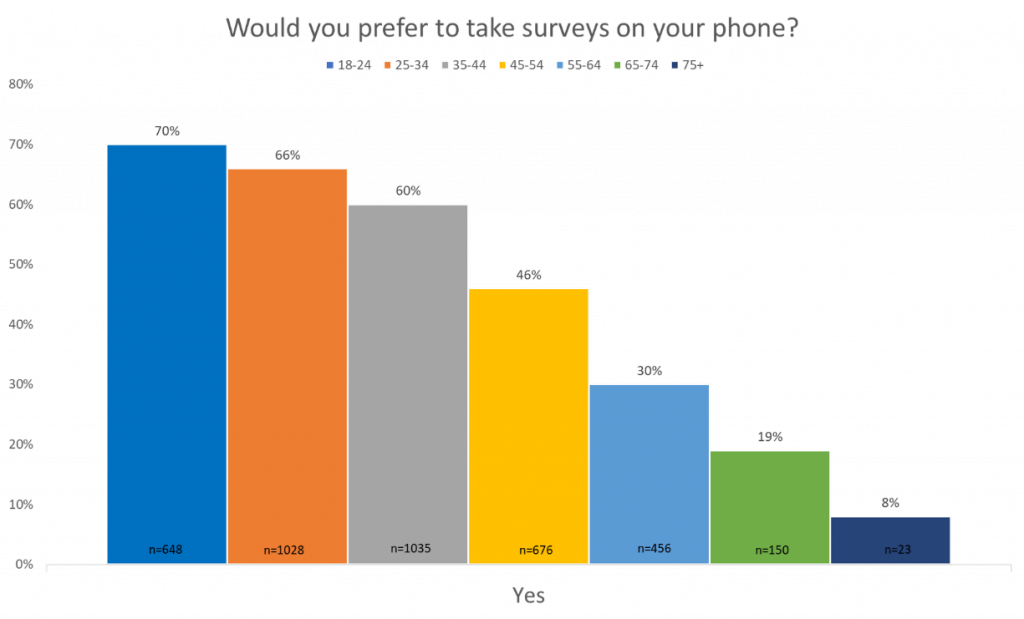
Respondents also prefer taking surveys on their phone less the older they are.
73 y/o: “Rewards that better reflect the time spent and survey companies actually losing my profile to select which survey to send me, i.e. quit sending me surveys I am too old for surveys that require a smartphone, etc.”
Finally, older respondents are more likely to not qualify for a survey.
70 y/o: “I feel like I don’t qualify for half the surveys I opt in for because of my age. Maybe open up your qualifications more.”
71 y/o: “I keep trying to take surveys, but I mostly seem to disqualify.”
Device
As mentioned earlier, respondents using smartphones report having the least enjoyable survey experience.
Smartphone user: “In order for me to continue doing this I wish surveying didn’t go based on eligibility because it discourages surveyors like myself who have really good intent on helping out on our feedback on anything.”
Smartphone user: “More companies offering legit surveys that will actually allow you to redeem whatever incentive is given for the survey.”
Desktop users also mostly feel that their responses are candid and accurate, which may be because older respondents are more likely to use desktops and are also more confident in their responses.
Desktop user: “Have the surveys guarantee a nice reward for us to provide accurate and honest answers.”
Desktop user: “I give my honest and heartfelt opinion and they sometimes don’t give me the credit I think I deserve.”
Respondents using desktops have the least number of respondents saying that incentives for surveys are adequate. This may be in correlation to older respondents reporting that incentives are not adequate and being more likely to take surveys on a desktop than a smartphone.
Desktop user: “Surveys take very long for very little reward. Also, many times surveys at the end just act as if you did not qualify, while you have filled out a whole survey before for 30 minutes and give you a couple of points (2-3.)”
Desktop user: I would take more surveys if the incentive were higher, preferably minimum $1 per survey and maximum $5.”
Our research also found that respondents using desktops and tablets are more likely to not qualify for a survey. This may be another correlation to older respondents having a harder time qualifying for surveys and also being more likely to use a desktop.
Desktop user: “Getting more relevant surveys that I actually qualify for.”
Tablet user: “I hate it when I take a survey for over an hour and at the end it says I didn’t qualify.”
Tablet user: “I usually don’t qualify for many surveys. I am honest in all my answers, I just don’t fit market demographics.”
So, what can we do as market researchers to create a better survey experience for respondents? First and foremost, we can take the time to develop high quality screeners and early disqualifiers so that respondents get removed from the survey as early as possible. While higher incentives may not always be an option, creating a survey with a reasonable length can reduce frustration, especially if a respondent gets disqualified or incentives are low. Lastly, optimizing your survey for mobile will be key. Mobile device usage is growing among respondents and it’s important to take this into account for your design so that they can have the best experience possible.
To learn more about people’s perceptions of different brands, download our 2020 Sample Landscape Report and check out our other blogs from the Sample Landscape series!
Respondent Experience and How It Can Be Improved


