Intellicast Episode 25: The Team’s Market Research Origin Stories
July 24, 2018
Importance of Service in the Sample Industry
August 6, 2018In the latest installment of our blog series, The Sample Landscape, we explore the differences among demos regarding the devices they used to respond to surveys, and how responses can differ by device.
Mobile Millennials and Dominating Desktops
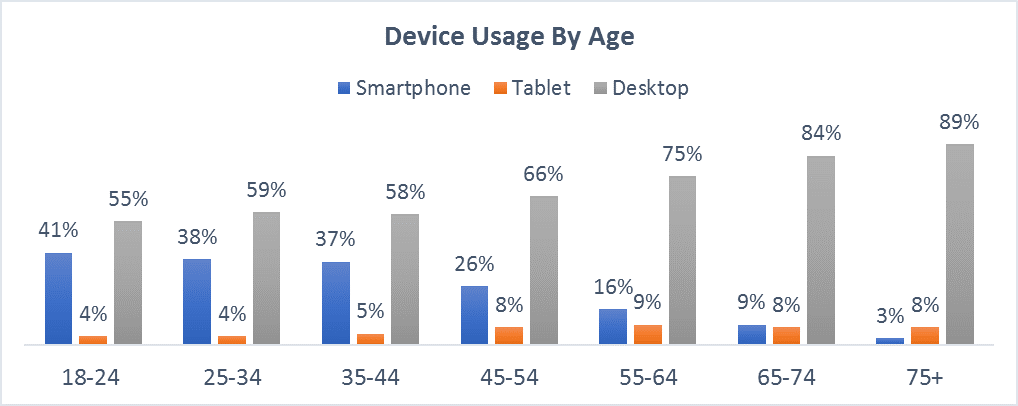
Unsurprisingly, our research found that as age increased, smartphone usage decreased. The “hip and trendy” Millennials were significantly more likely to take the survey on a smartphone than Gen X-ers and Baby Boomers. We found 41% of respondents between the ages of 18 and 24 took the survey on a smartphone – significantly higher than all other age groups other than 24-35-year-olds.
In general, respondents prefer to stick to the traditional desktop to take surveys, even Millennials. This could be artificially inflated by factors such as long surveys, poorly designed questions, mobile device blocks, question format, or other factors.
Desktops are definitely the most favored device, which is not news. What was interesting was how little usage of tablets was overall, and the lack of smartphone usage in the over 55 crowd. We assumed it would be low, but not as low as it was since many of these people are still in the workforce and probably own a smartphone.
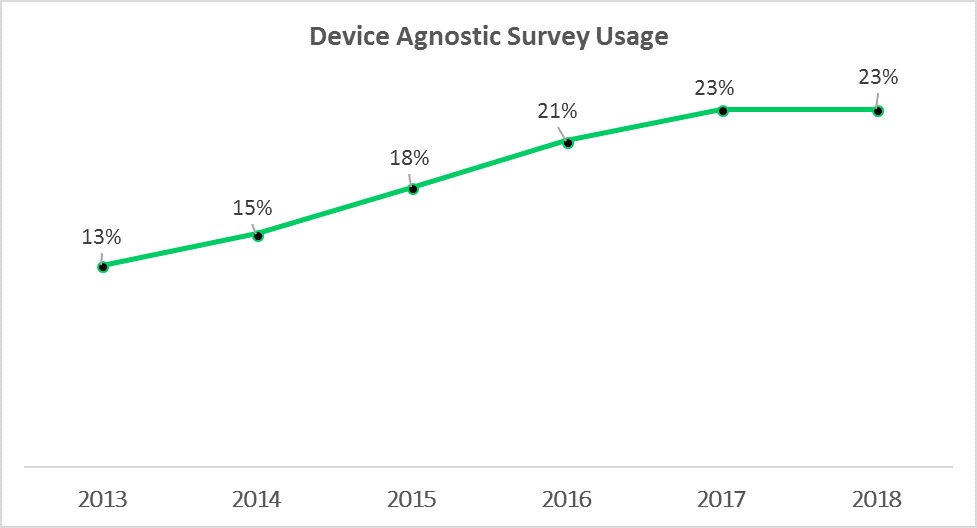
While a good portion of respondents still take surveys on tablets and desktops, device agnostic surveys are on the rise. Since 2013, usage of mobile surveys has increased 10 percentage points from 13% in 2013 to 23% in 2018. That’s a big jump in 5 years! While this growth is a large jump, 23% is lagging considering smartphone penetration is 80% or more in most countries
The Difference by Device is Apparent
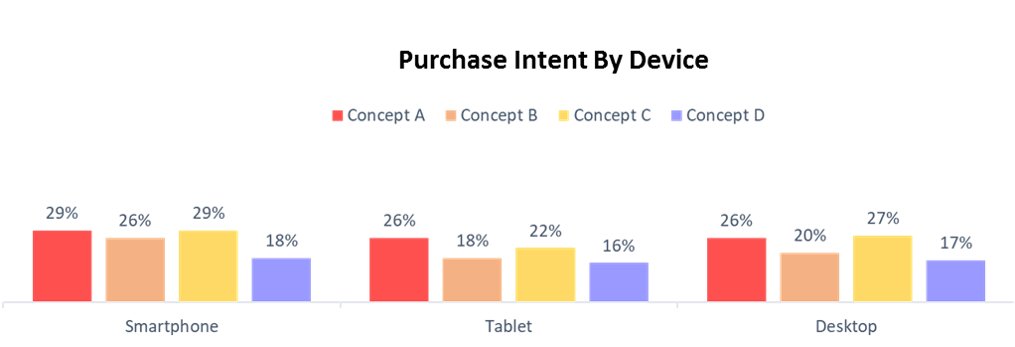
We were surprised to find that device impacts results on purchase intent questions. In our survey we asked about four different concepts – what we found was the three out of four were rated significantly higher on smartphone devices than on tablets or desktops.
For example, Concept A purchase intent on a smartphone was 29%. Purchase intent on a desktop was measurably lower at 26%. Concept B’s purchase intent on a smartphone was, significantly higher than on a tablet or desktop. Similarly, Concept C purchase intent was 2 to 5 percentage points lower on tablet and desktops than on smartphones. The only concept that did not have significant differences in purchase intent was Concept D.
Can we conclude that people who take surveys on smartphones are more open to new ideas, and people that take surveys on desktops are not? As we all learned in market research 101, correlation does not equal causation, and the underlying factor is likely the difference in survey experience.
Device Agnostic Design Impact
Based on the difference in results we have found by device, it truly reinforces the need for surveys to be designed device agnostic. This means that no matter the device (smartphone, tablet, desktop, etc.) a respondent uses to take a survey, they will have the same experience. Utilizing this design mythology can ensure you get the best results possible. When not used, you may inadvertently skew your results because you either favored a specific device-type over another.
When designing surveys, it is important to keep in mind that device can greatly impact experience and results. To find out how EMI can assist in making your next project device agnostic, request a free consultation.
Footnote: Results are based on 2912 respondents from 12 different US consumer panels.


