

What’s on the Summer Agenda? How Americans Are Making the Most of Longer Days
July 9, 2026
The State of Americans’ Personal Finances: Who Is Worse Off, Better Off, or Holding Steady?
July 22, 2026
Respondents were asked to compare the current cost of several common expenses with the same time last year. The full response scale ranged from “much more expensive today” to “much less expensive today,” with additional options for “about the same” and “don’t know/not applicable.”
For the main results, responses were condensed into three measures: top two box (T2B), representing “much more” or “somewhat more expensive”; bottom two box (B2B), representing “somewhat less” or “much less expensive”; and “about the same.” The demographic comparisons focus on six categories and show only T2B and “about the same” results.
Overall
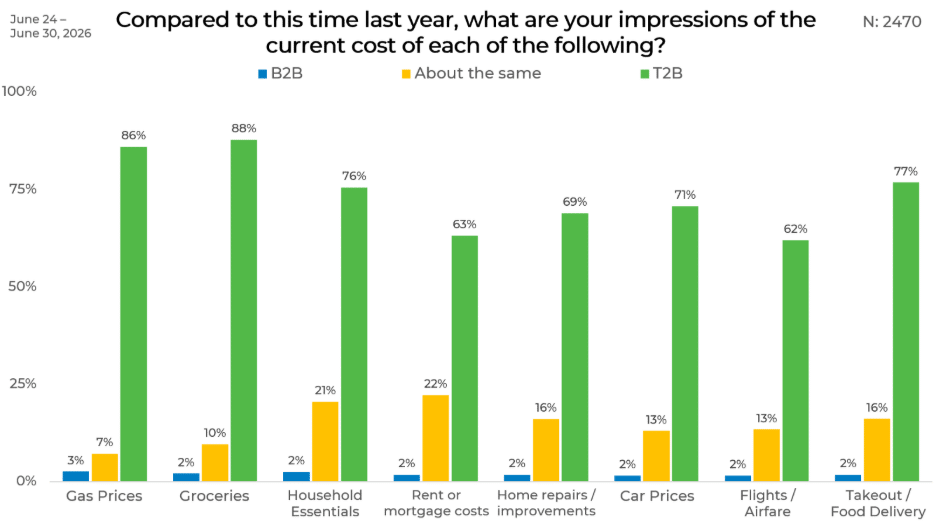
Groceries and gas prices generate the strongest impressions of rising costs. Overall, 88% say groceries are more expensive than a year ago, while 86% say the same about gas prices. Only 10% describe grocery prices as about the same, and 7% say gas prices have remained unchanged.
More than three-quarters also report higher costs for takeout or food delivery, at 77%, and household essentials, at 76%. Perceptions are less pronounced for rent or mortgage costs and airfare, although majorities still say both are more expensive, at 63% and 62%, respectively. These two categories also receive some of the highest “about the same” readings, at 22% for housing costs and 13% for airfare.
Gender
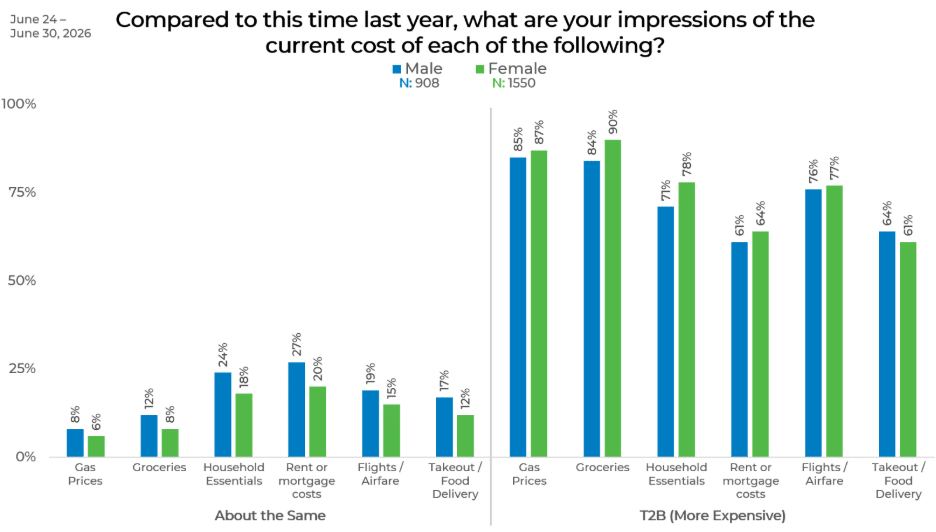
Women are more likely than men to report higher costs across most categories. The largest gender gap appears for household essentials, with 78% of women saying they are more expensive compared with 71% of men. Women are also more likely to report higher grocery prices, at 90% versus 84%, and slightly more likely to say gas, housing, and takeout costs have increased.
Men are consistently more likely to describe prices as about the same. The widest differences appear for rent or mortgage costs, at 27% among men and 20% among women, and household essentials, at 24% and 18%. Airfare is the only category in which men are more likely to report higher costs, at 64% compared with 61% of women.
Age
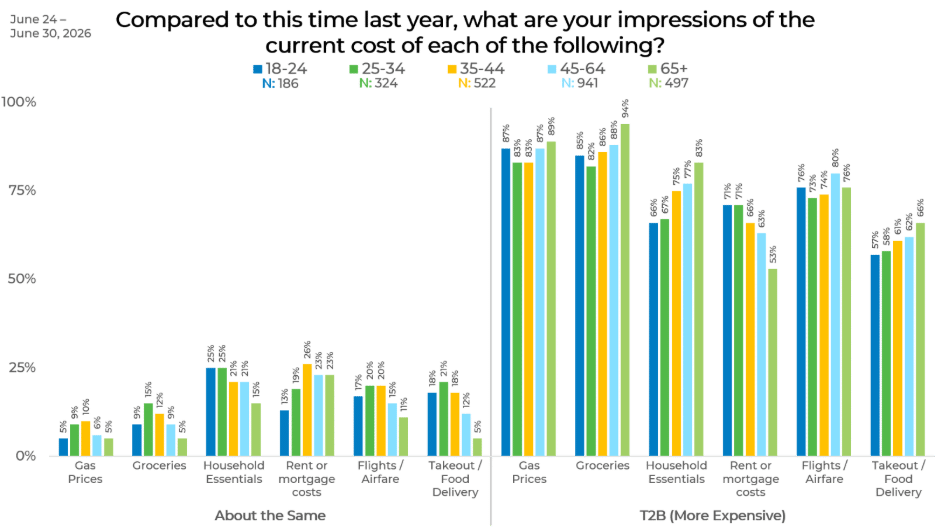
Age produces some of the clearest differences, particularly for housing and household essentials. Seventy-one percent of adults ages 18 to 24 and 25 to 34 say rent or mortgage costs are higher, compared with 53% of those 65 and older. Household essentials show the opposite pattern, rising from 66% among 18-to-24-year-olds to 83% among adults 65 and older.
Older adults are also more likely to report higher grocery and airfare costs. Grocery T2B reaches 94% among those 65 and older, compared with 82% among respondents ages 25 to 34. Airfare rises from 57% among the youngest group to 66% among the oldest, while the share saying flights cost about the same falls from 18% to 5%.
Income
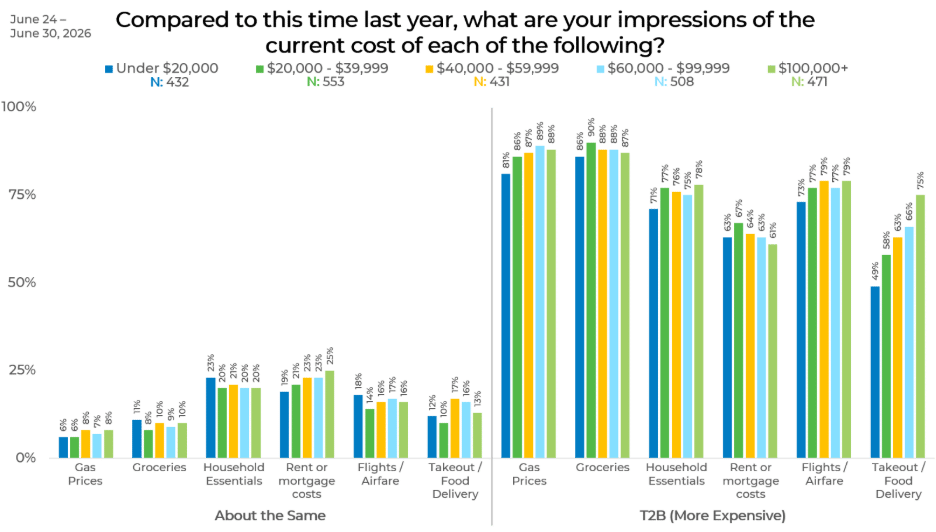
The largest income difference appears for airfare. Three-quarters of respondents earning $100,000 or more say flights are more expensive, compared with 49% of those earning under $20,000. The figure rises steadily across most income groups, reaching 58% among those earning $20,000 to $39,999, 63% among those earning $40,000 to $59,999, and 66% among those earning $60,000 to $99,999.
Other categories vary less by income. Grocery T2B ranges from 86% to 90%, household essentials from 71% to 78%, and rent or mortgage costs from 61% to 67%. Respondents earning $100,000 or more are the most likely to say housing costs are about the same, at 25%, compared with 19% among those earning less than $20,000.
Political Affiliation
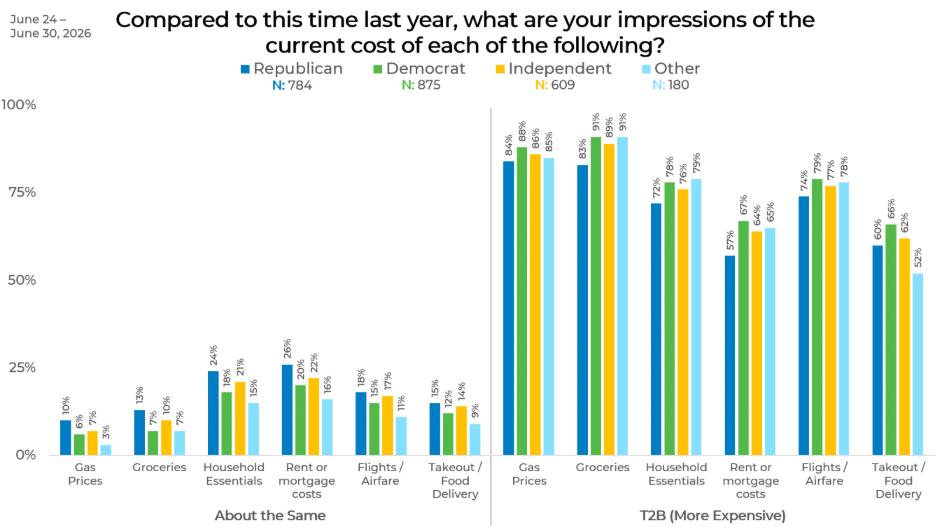
The largest political difference concerns rent or mortgage costs. Democrats are 10 points more likely than Republicans to say these expenses are higher, at 67% versus 57%. Independents and respondents identifying with another political affiliation fall between them at 64% and 65%. Democrats also report higher figures than Republicans for groceries, household essentials, takeout, gas, and airfare.
Respondents in the Other group stand out on airfare: 52% say flight costs are higher, compared with 60% of Republicans, 62% of Independents, and 66% of Democrats. Republicans are generally the most likely to say costs are about the same, including 26% for rent or mortgage costs, 24% for household essentials, and 13% for groceries.
Ethnicity
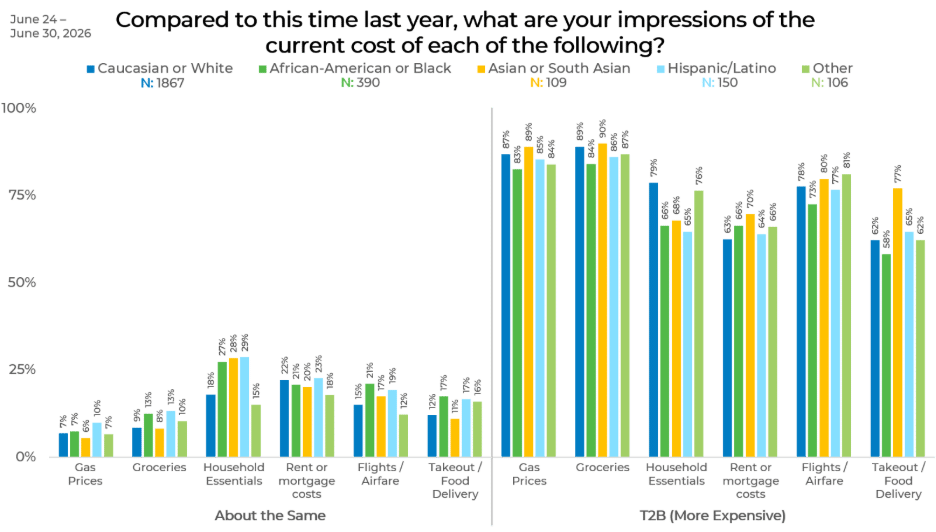
The largest difference by race and ethnicity concerns household essentials. Seventy-nine percent of White respondents say these costs are higher, compared with 65% of Hispanic or Latino respondents, 66% of Black respondents, and 68% of Asian or South Asian respondents. At the same time, 29% of Hispanic or Latino respondents, 28% of Asian or South Asian respondents, and 27% of Black respondents say household-essential costs are about the same.
Airfare also varies substantially. Asian or South Asian respondents are the most likely to report higher flight costs, at 77%, compared with 58% of Black respondents and 62% of both White and Other respondents. Views of gas and grocery prices are more consistent, with gas T2B ranging from 83% to 89% and grocery T2B from 84% to 90%.
Region
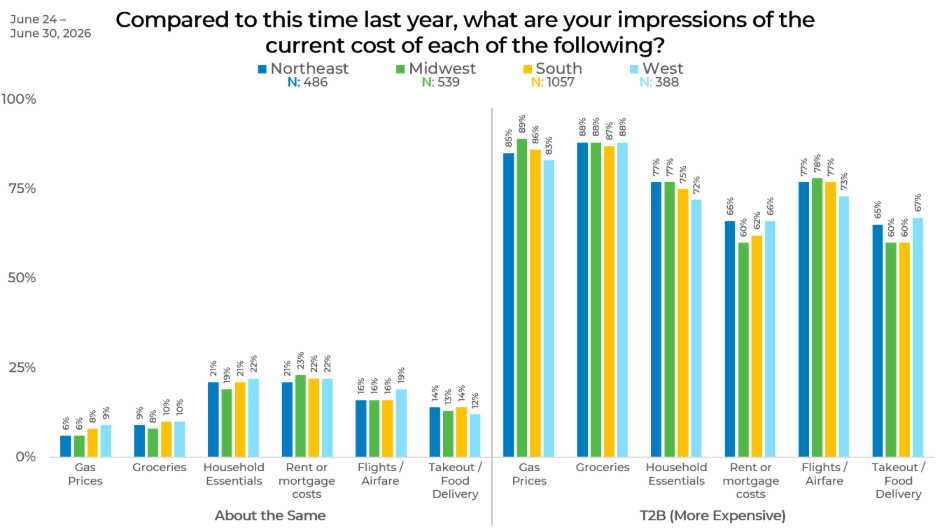
Regional views are closely aligned for groceries, gas, and takeout. The share saying groceries are more expensive ranges only from 87% in the South to 88% in the other three regions. Gas prices range from 83% in the West to 89% in the Midwest, while takeout or delivery ranges from 73% in the West to 78% in the Midwest.
The largest regional contrast appears for airfare. Sixty-seven percent in the West say flight costs are higher, compared with 60% in both the Midwest and South. Rent or mortgage costs are viewed as more expensive by 66% in the Northeast and West, versus 60% in the Midwest and 62% in the South.
Panel
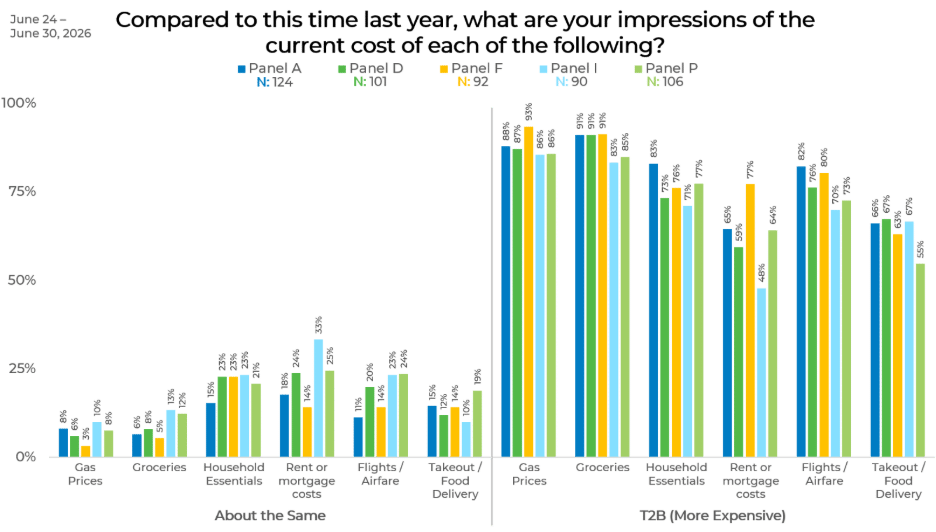
Combining several panels provides a broader view of where respondent sources align and where their readings differ. The largest gap appears for rent or mortgage costs: 77% of Panel F says these expenses are higher, compared with 48% of Panel I, a 29-point difference. Panel I is also the most likely to say housing costs are about the same, at 33%, while Panel F is the least likely, at 14%.
Airfare shows the next-largest contrast, ranging from 55% in Panel P to 67% in Panels D and I. Panel A records the highest T2B figures for household essentials and takeout, at 83% and 82%, while Panel I records the lowest at 71% and 70%. Gas and groceries are more consistent across panels, although Panel F leads on gas at 93%, and Panels A, D, and F each reach 91% for groceries.
Wrap Up
Across demographics, respondents consistently perceive higher costs across everyday spending categories, with groceries, gas, and household essentials standing out as the strongest areas of concern. While perceptions vary by age, income, political affiliation, ethnicity, region, and panel source, the overall sentiment is clear: rising prices continue to shape consumer experiences.
To better understand how these trends may impact your organization, connect with our team to discuss the findings, explore audience-specific insights, and identify opportunities to respond to changing consumer expectations.