

Fireworks Are Just the Beginning: The Fourth of July Traditions Taking Center Stage
July 3, 2026
The Cost of Everyday Life: How Americans View Price Changes Since Last Year
July 16, 2026
Many people imagine how they will spend the longer days and warmer weather, whether that means traveling, reconnecting with loved ones, or simply enjoying time outdoors. This blog explores the types of activities people expect to take part in over the summer, looking into common plans and how they vary across different groups.
Overall
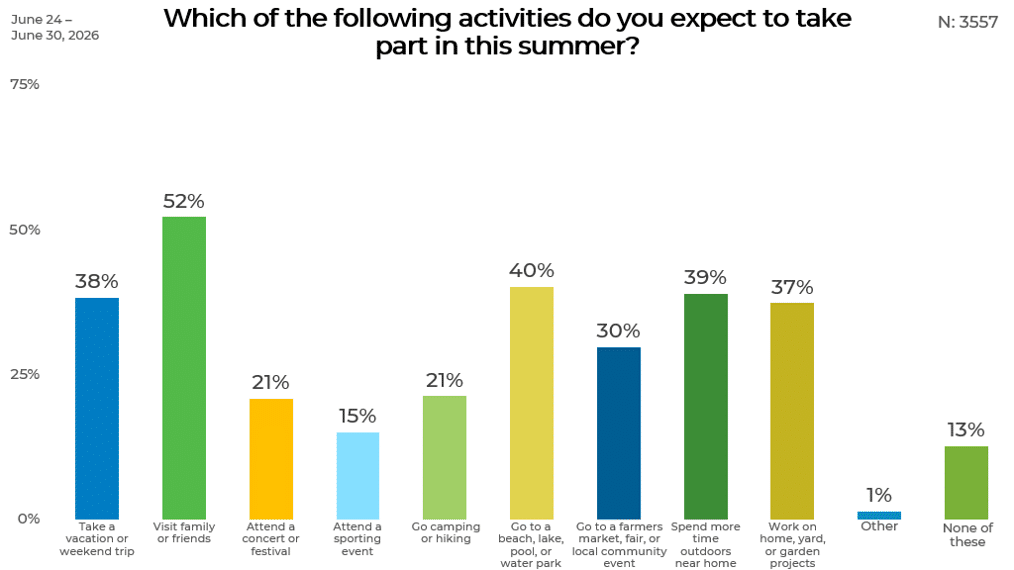
Summer plans span a variety of activities, with visiting family or friends the most common at 52%. Other popular plans include going to a beach, lake, pool, or water park (40%), spending more time outdoors near home (39%), taking a vacation or weekend trip (38%), and working on home, yard, or garden projects (37%). Fewer respondents expect to attend farmers markets or community events (30%), concerts or festivals (21%), or go camping or hiking (21%), while 15% plan to attend sporting events. Thirteen percent say they will take part in none of these activities, and 1% selected another option.
Gender
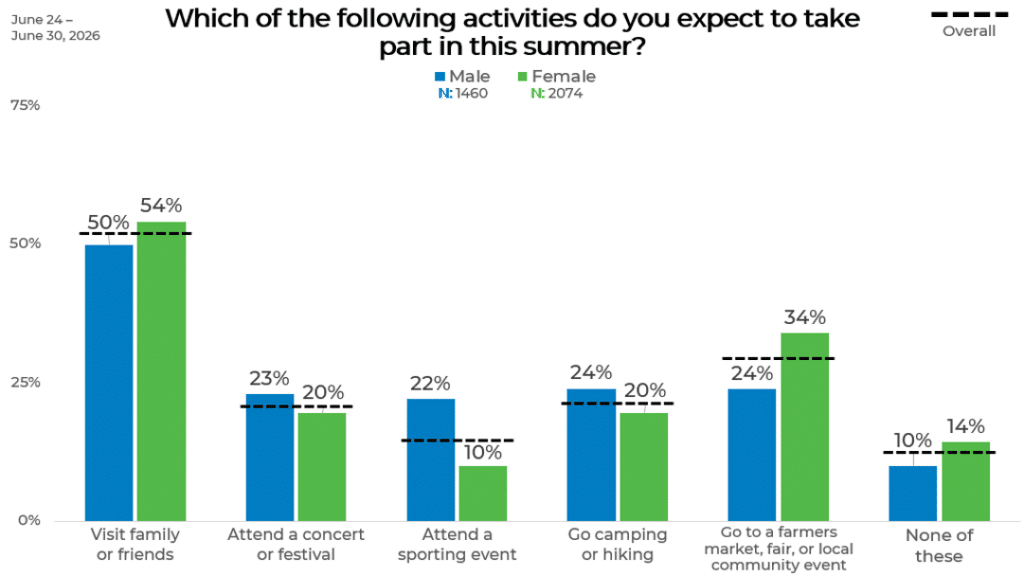
The largest gender difference appears around sporting events. Men are more than twice as likely as women to say they expect to attend a sporting event this summer, at 22% compared with 10%. There is also a notable gap on farmers markets, fairs, or local community events, but in the opposite direction: 34% of women expect to take part in those activities, compared with 24% of men.
Other differences are smaller. Men are slightly more likely than women to expect to attend a concert or festival, at 23% versus 20%, and to go camping or hiking, at 24% versus 20%. Women are slightly more likely to say they will visit family or friends, at 54% compared with 50% of men. Fourteen percent of women say none of these, compared with 10% of men.
Age
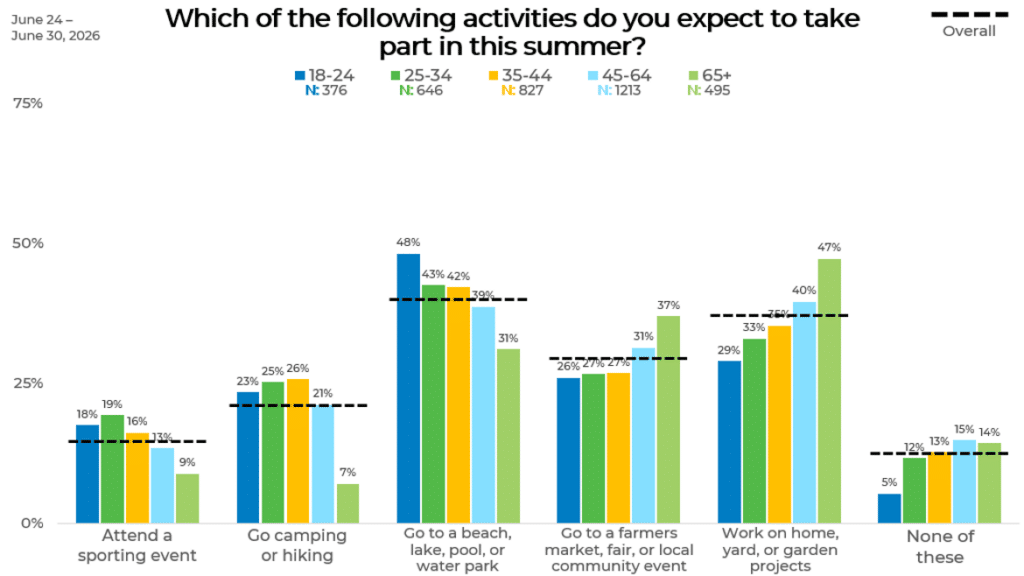
Age differences are especially visible in home, yard, or garden projects and camping or hiking. Working on home, yard, or garden projects rises steadily with age, from 29% among those ages 18–24 to 47% among adults 65 and older. Farmers markets, fairs, or local community events also increase with age, reaching 37% among those 65 and older compared with 26% to 31% among younger and middle-aged groups.
By contrast, some more active or travel-adjacent activities are lower among the oldest adults. Camping or hiking ranges from 21% to 26% among respondents under 65, but drops to 7% among those 65 and older. Plans to go to a beach, lake, pool, or water park are highest among 18- to 24-year-olds at 48% and lowest among those 65 and older at 31%. Sporting events also decline with age, from 18% among those 18–24 and 19% among those 25–34 to 9% among those 65 and older.
Income
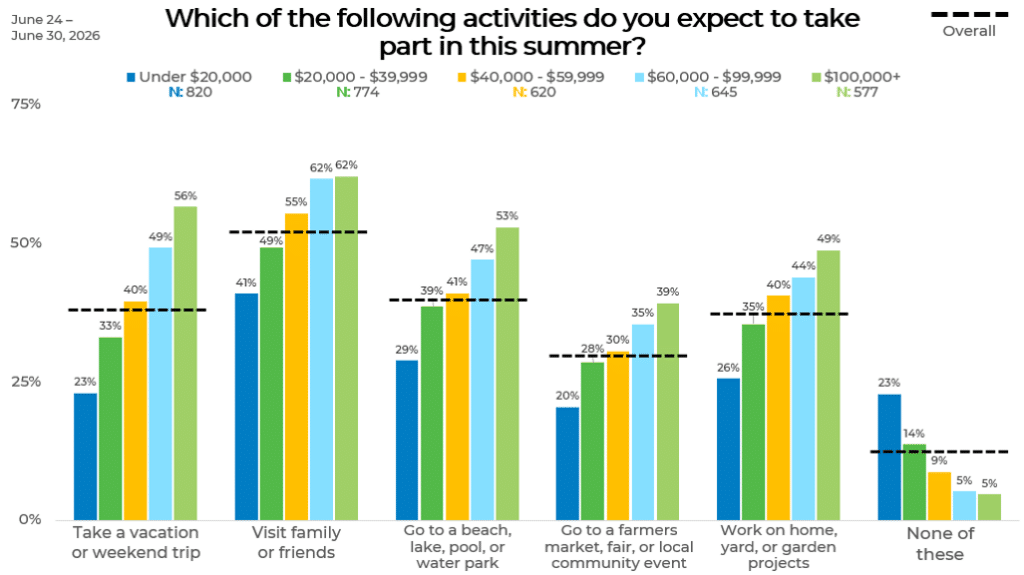
Income shows some of the clearest step-by-step differences in the data. Taking a vacation or weekend trip rises from 23% among those earning under $20,000 to 56% among those earning $100,000 or more. Visiting family or friends follows a similar pattern, increasing from 41% in the lowest income group to 62% among those earning $60,000–$99,999 and those earning $100,000 or more.
Other activities also become more common as income rises. Plans to go to a beach, lake, pool, or water park increase from 29% among those under $20,000 to 53% among those at $100,000 or more. Farmers markets, fairs, or local community events rise from 20% to 39%, while home, yard, or garden projects rise from 26% to 49%. The “none of these” response moves in the opposite direction, falling from 23% among those under $20,000 to 5% among those earning $60,000 or more.
Political Affiliation
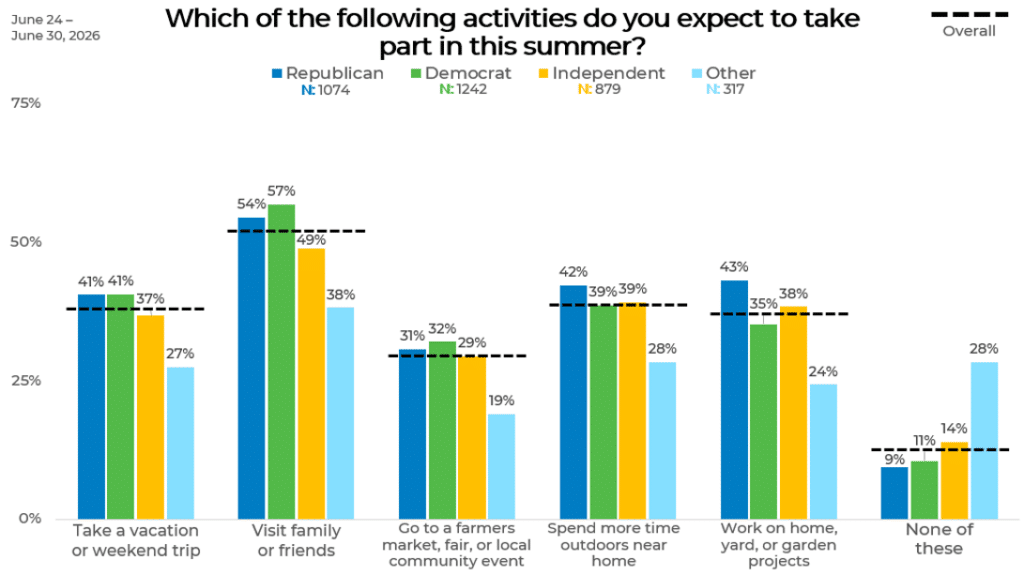
Across party identification, the largest differences are concentrated among those identifying as “Other.” Twenty-eight percent of this group say they expect to do none of the listed activities, compared with 14% of Independents, 11% of Democrats, and 9% of Republicans. This same group is also lower across several specific summer activities, including visiting family or friends, taking a vacation or weekend trip, and working on home, yard, or garden projects.
Among Republicans, Democrats, and Independents, visiting family or friends remains one of the leading activities, though Democrats are highest at 57%, followed by Republicans at 54% and Independents at 49%. Republicans and Democrats are tied on taking a vacation or weekend trip at 41%, while Independents are slightly lower at 37%. Republicans are most likely to say they will work on home, yard, or garden projects, at 43%, compared with 38% of Independents and 35% of Democrats.
Ethnicity
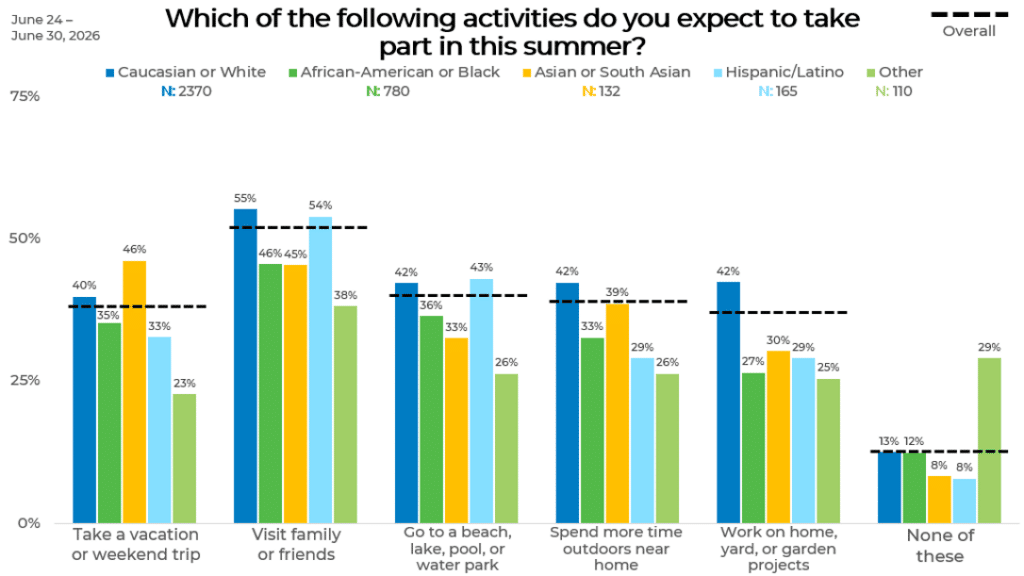
The largest differences by race and ethnicity appear among respondents categorized as Other, who are less likely to select several listed activities and more likely to say none of these. Twenty-nine percent of this group selected none of the listed activities, compared with 13% of White respondents, 12% of Black respondents, and 8% each among Asian or South Asian and Hispanic/Latino respondents.
Among specific activities, White respondents are highest for visiting family or friends at 55%, closely followed by Hispanic/Latino respondents at 54%. Asian or South Asian respondents are highest for taking a vacation or weekend trip, at 46%, compared with 40% of White respondents, 35% of Black respondents, and 33% of Hispanic/Latino respondents. Plans to go to a beach, lake, pool, or water park are highest among Hispanic/Latino respondents at 43% and White respondents at 42%, while home, yard, or garden projects are highest among White respondents at 42%.
Region
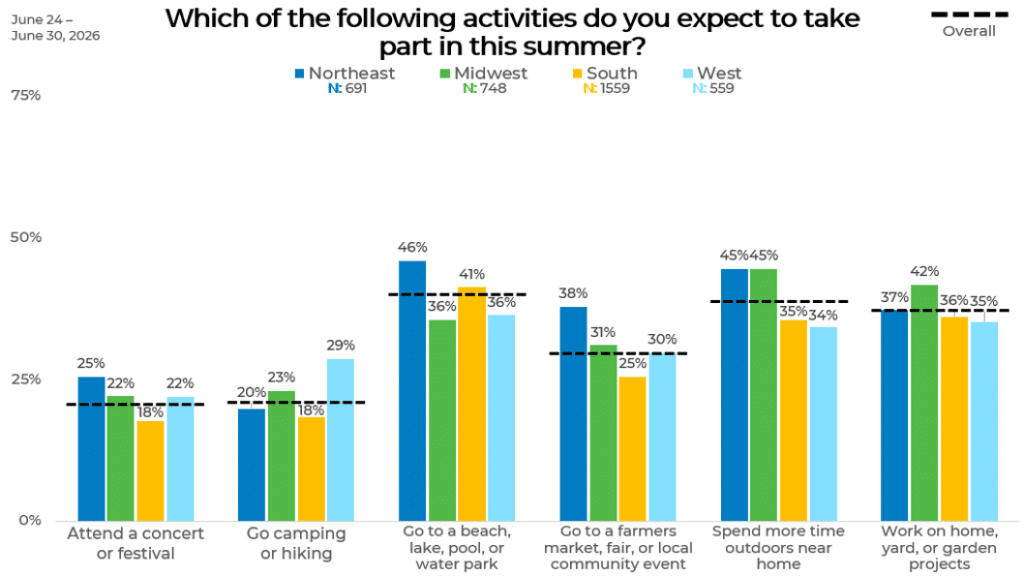
Regionally, the largest differences appear in outdoor activities near home and community events. Spending more time outdoors near home is highest in the Northeast and Midwest, both at 45%, while the South is at 35% and the West is at 34%. Farmers markets, fairs, or local community events are also highest in the Northeast, at 38%, compared with 31% in the Midwest, 30% in the West, and 25% in the South.
Beach, lake, pool, or water park plans are most common in the Northeast at 46%, followed by the South at 41%. The Midwest and West are both lower at 36%. Camping or hiking is highest in the West, where 29% expect to take part, compared with 23% in the Midwest, 20% in the Northeast, and 18% in the South. Home, yard, or garden projects are highest in the Midwest at 42%, while the Northeast, South, and West are grouped between 35% and 37%.
Panel
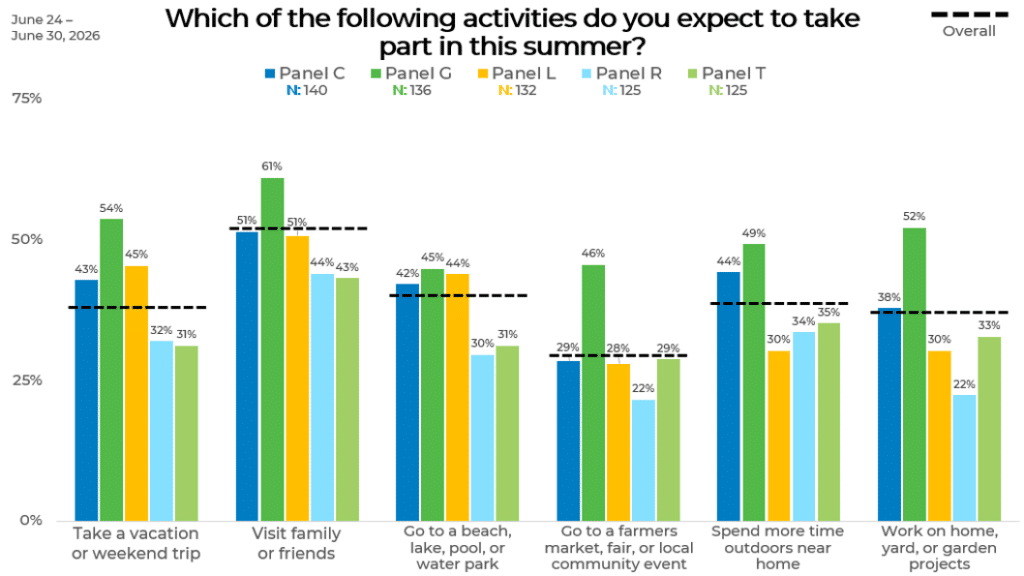
Panel comparisons show clear differences across respondent groups, with Panel G consistently reporting the highest participation in nearly every activity, including visiting family or friends (61%), taking a vacation or weekend trip (54%), working on home, yard, or garden projects (52%), and attending farmers markets or community events (46%). The largest gap appears in home, yard, or garden projects, where Panel G’s 52% is far higher than Panel R’s 22% and Panel L’s 30%. Similar patterns appear in other activities, such as farmers markets (46% in Panel G vs. 22% in Panel R) and travel (54% in Panel G vs. 31% in Panel T and 32% in Panel R). Overall, Panel C and Panel L tend to align more closely with each other, while Panel R and Panel T consistently report lower participation across many summer plans.
Wrap Up
Summer plans reflect a mix of connection, recreation, and time spent outdoors. Visiting family and friends remains the most common activity, while travel, local activities, and home projects also shape how people plan to enjoy the season.
Across demographics, preferences vary by factors such as income, age, and region, with some groups more likely to travel or participate in certain activities. Overall, summer continues to be a season focused on experiences, connection, and making the most of warmer months. Connect with EMI to explore these findings in more depth and discuss what they mean for your strategy.