

The Cost of Everyday Life: How Americans View Price Changes Since Last Year
July 16, 2026
The Top Trends Impacting MRX with Matt Valle of the Rock n’ Roll Research Podcast
July 23, 2026The State of Americans’ Personal Finances: Who Is Worse Off, Better Off, or Holding Steady?

Cost-of-living pressures can shape several parts of household finances, from disposable income and bill payments to savings and debt. In our recent round of research-on-research, we asked respondents to compare their personal financial situation today with the same time last year using a five-point scale ranging from “much worse today” to “much better today.”
Let’s see if consumers are seeing spending relief or increased pressure.
Overall
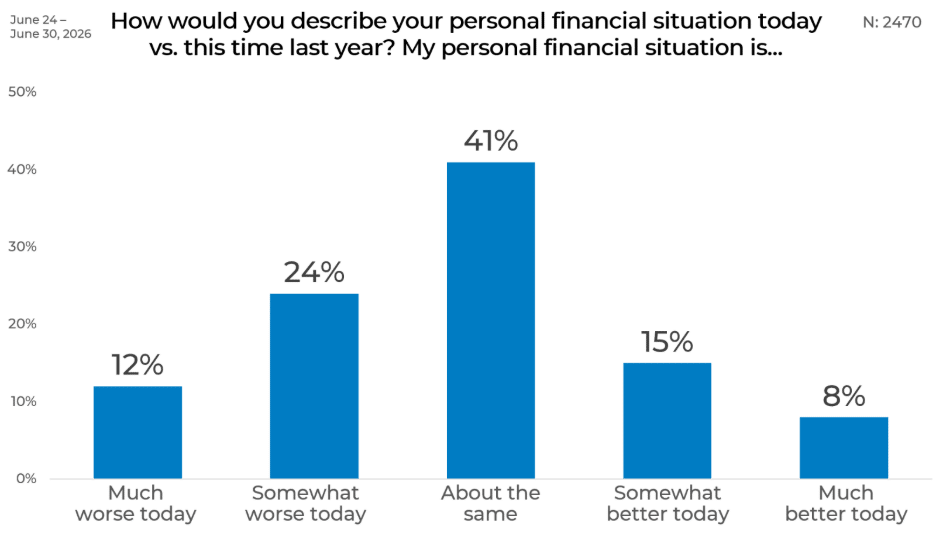
Among all respondents, 41% said their personal financial situation was about the same as it had been a year earlier. Another 36% reported that it had worsened, including 24% who said they were somewhat worse off and 12% who said they were much worse off.
By comparison, 23% said their finances had improved. This included 15% who described themselves as somewhat better off and 8% who said they were much better off. Overall, respondents were therefore more likely to report a decline than an improvement, while the largest single group experienced little change.
Gender
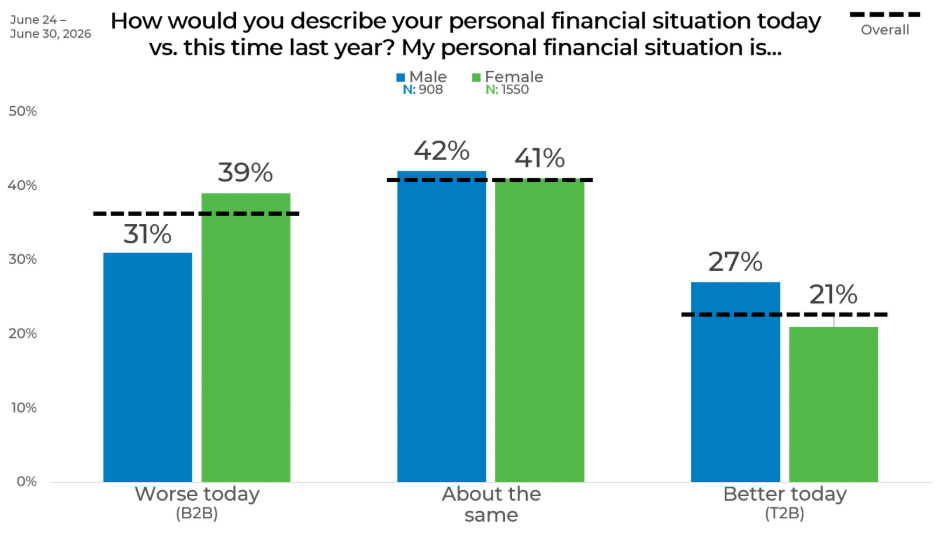
Women were more likely than men to say their financial situation had worsened. A combined 39% of women reported being worse off than a year ago, compared with 31% of men, an eight-point difference.
Men were also more likely to report improvement, at 27%, versus 21% of women. The share saying their situation was about the same was nearly identical, accounting for 42% of men and 41% of women.
Age
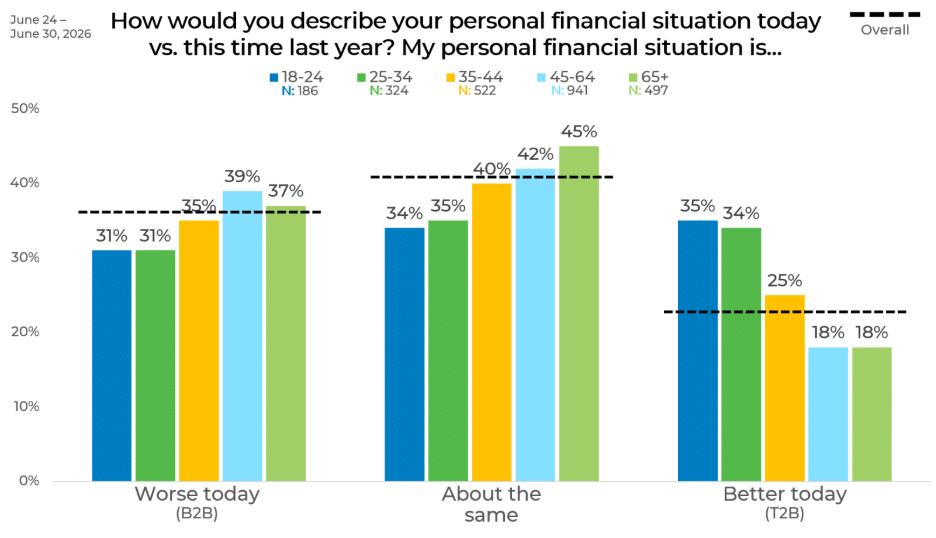
Age produced some of the clearest differences in the results. Younger adults were much more likely to report financial improvement than older respondents. Among those ages 18 to 24, 35% said they were better off than a year earlier, closely followed by 34% of those ages 25 to 34. That figure fell to 25% among adults ages 35 to 44 and to 18% among both the 45-to-64 and 65-and-older groups.
Older adults were more likely to say their financial situation had remained stable. The share reporting no change rose steadily from 34% among respondents ages 18 to 24 to 45% among those ages 65 and older. Reports of worsening finances were highest among adults ages 45 to 64, at 39%, followed by those 65 and older at 37%.
Income
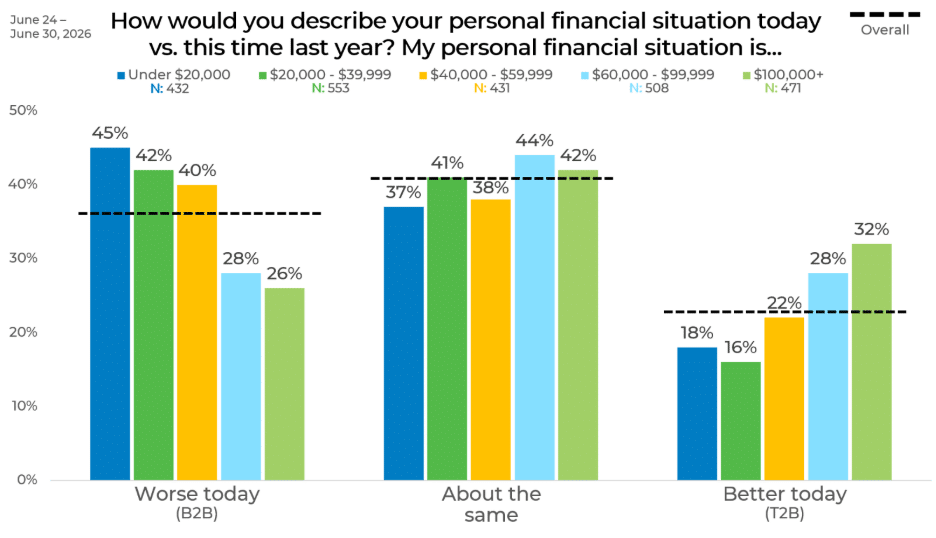
The results showed a pronounced divide by income. Among respondents earning less than $20,000, 45% said their financial situation was worse than it had been a year earlier. The figure declined as income increased, falling to 42% among those earning $20,000 to $39,999, 40% among those earning $40,000 to $59,999, 28% among those earning $60,000 to $99,999, and 26% among those earning $100,000 or more.
The pattern for financial improvement moved in the opposite direction. Nearly one-third of respondents earning at least $100,000 said they were better off, at 32%, compared with 28% among those earning $60,000 to $99,999. Improvement was less common among lower-income respondents, including 18% of those earning less than $20,000 and 16% of those earning $20,000 to $39,999.
Political Affiliation
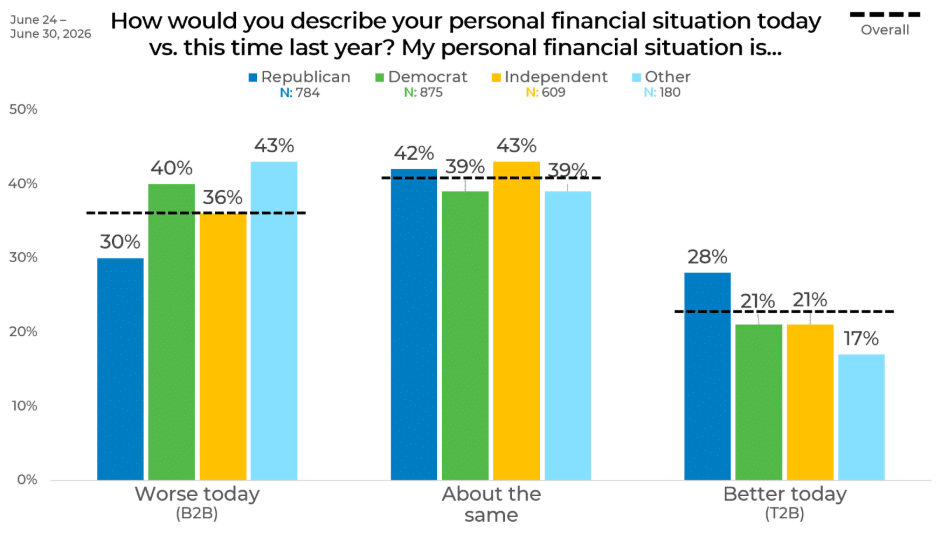
Reports of worsening finances were most common among respondents identifying with another political affiliation, at 43%, followed by Democrats at 40%. Independents stood at 36%, while Republicans were least likely to report being worse off, at 30%.
Republicans were also the most likely to say their financial situation had improved, with 28% selecting one of the better categories. The comparable figure was 21% among both Democrats and Independents and 17% among those identifying with another affiliation. Independents were the most likely to report no change, at 43%, narrowly ahead of Republicans at 42%.
Ethnicity
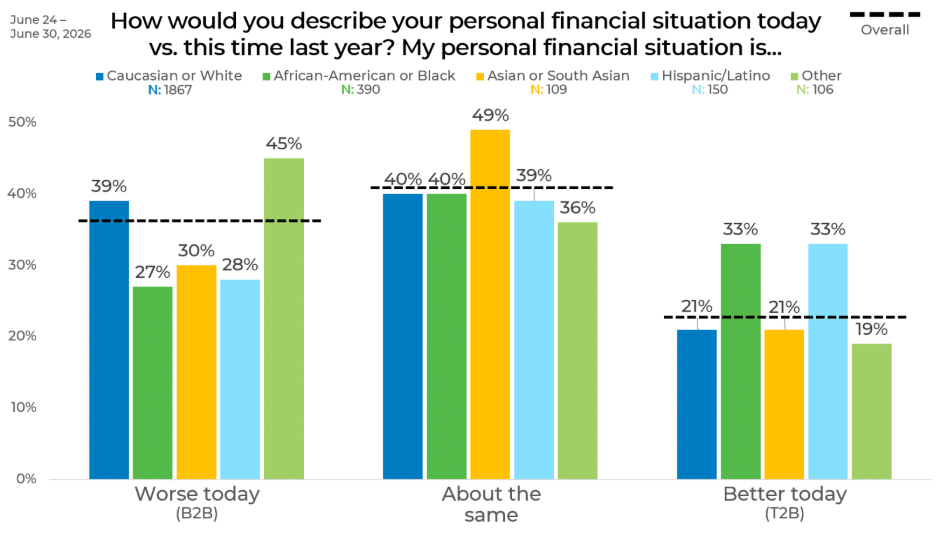
Respondents categorized as Other were the most likely racial or ethnic group to report worsening finances, at 45%. White respondents followed at 39%. Lower shares were recorded among Asian or South Asian respondents at 30%, Hispanic or Latino respondents at 28%, and Black respondents at 27%.
Black and Hispanic or Latino respondents were the most likely to say their financial position had improved, with 33% in each group reporting that they were better off. That compared with 21% among both White and Asian or South Asian respondents and 19% among respondents categorized as Other. Asian or South Asian respondents stood out for stability, with 49% saying their situation was about the same, the highest share across these groups.
Region
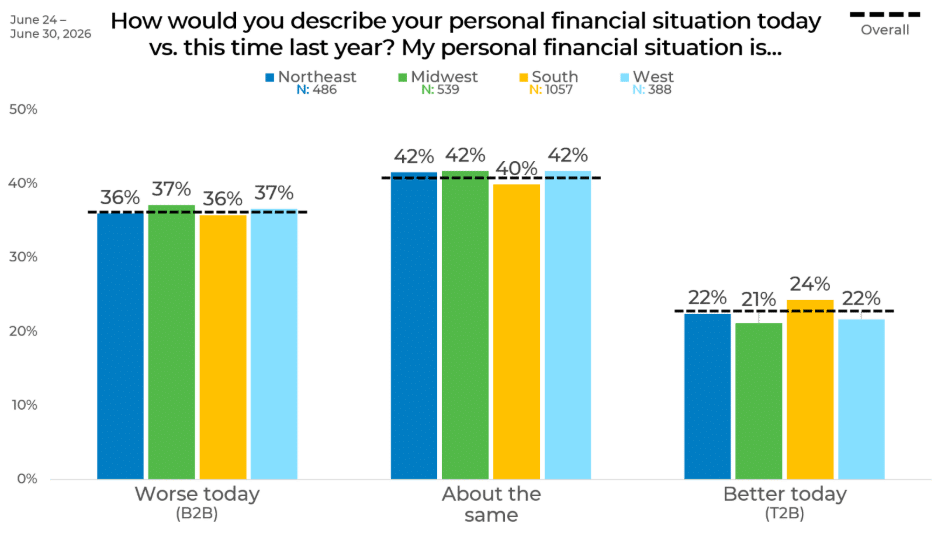
Financial assessments were highly consistent across regions. The share reporting a worse financial situation ranged only from 36% in the Northeast and South to 37% in the Midwest and West.
Similarly, 42% of respondents in the Northeast, Midwest, and West said their circumstances were about the same, compared with 40% in the South. Improvement was reported by 24% of Southern respondents, slightly above the 22% recorded in the Northeast and West and the 21% recorded in the Midwest.
Panel
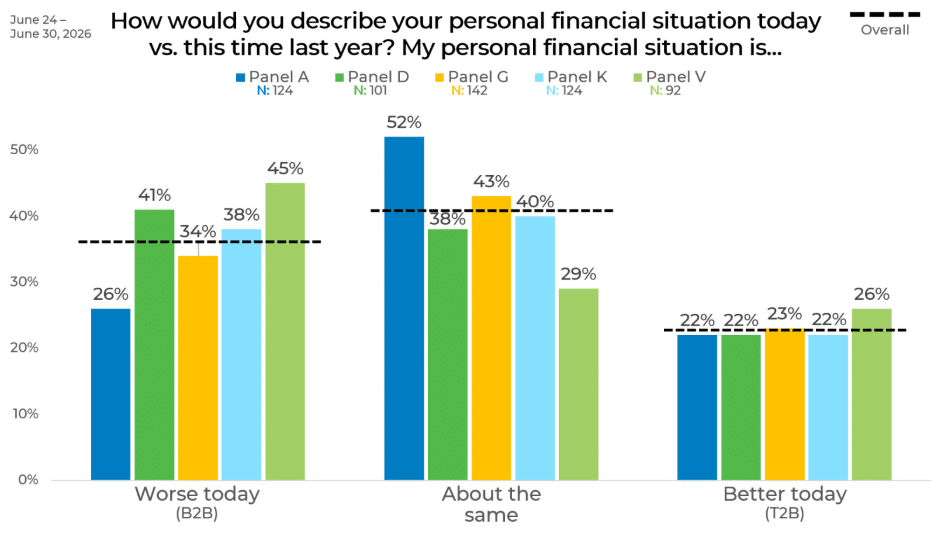
The largest differences across panels appeared in the shares reporting worsening finances and no change. Panel V had the highest proportion saying they were worse off, at 45%, compared with just 26% in Panel A, a 19-point gap. Conversely, 52% of Panel A respondents said their financial situation was about the same, while only 29% of Panel V respondents did so, a difference of 23 points.
Panels D and K also recorded relatively high shares reporting deterioration, at 41% and 38%, respectively, while Panel G stood at 34%. Reports of improvement were much more consistent, ranging from 22% in Panels A, D, and K to 23% in Panel G and 26% in Panel V. Viewed together, the panels provide several perspectives on the same question, with the greatest variation concentrated in whether respondents described their finances as worse or unchanged rather than better.
Wrap Up
While the largest share of respondents reported little change in their personal finances, those experiencing deterioration outnumbered those reporting improvement. The differences across income and age groups are particularly notable, while political affiliation, ethnicity, and panel results reveal additional variation in how Americans are experiencing today’s economic pressures.
As cost-of-living pressures continue to shape household finances, these results offer an important snapshot of who feels financially strained, who is seeing improvement, and who is holding steady. Explore the full findings to understand the demographic patterns behind Americans’ financial outlook and see where the greatest differences emerge.