
Should I ChatGPT This or Not?
August 28, 2026
In the news over the last few months, there seems to be a shift in public sentiment toward artificial intelligence. There have been more stories about how people dislike it (some even hating it). This is a topic we wanted to explore further.
In our recent wave of research-on-research, we asked consumers how they feel about the impact of AI on society to get a better gauge of whether the recent news reflects actual feelings.
Let’s dive in.
Overall
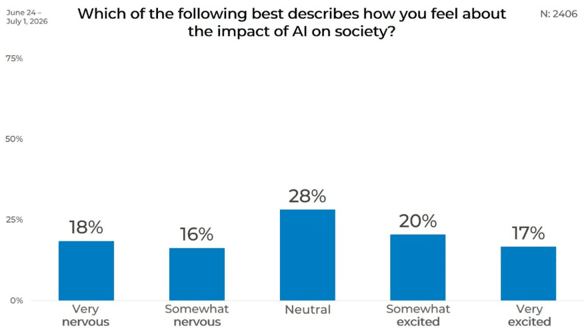
Overall, there is a fairly even split among respondents who are nervous about AI’s impact (34%) and those who are excited (37%). Another 28% of respondents are neutral.
Gender
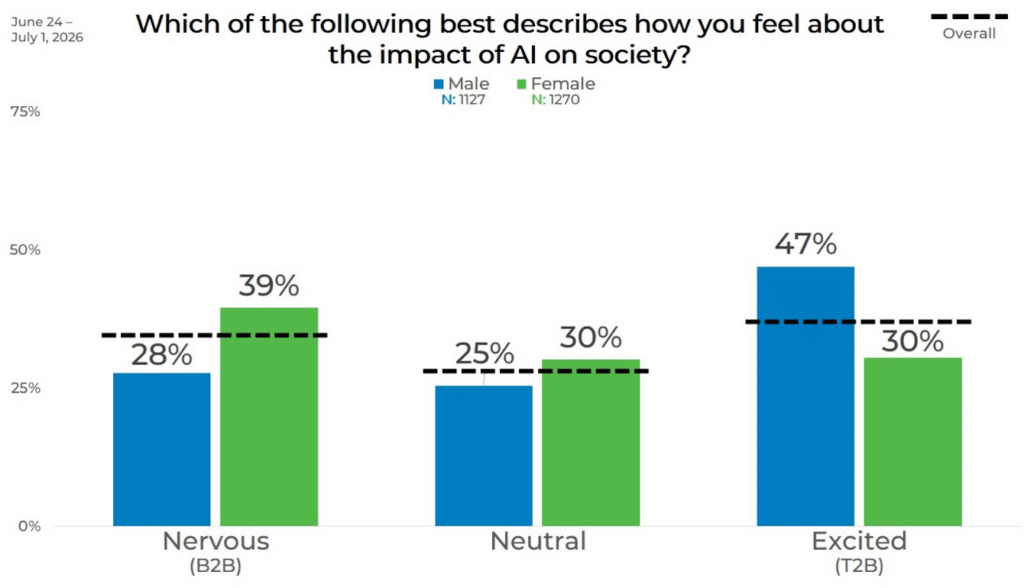
Segmenting the data by gender, we find that men are far more excited (47%), and females are more nervous (39%) about AI’s impact on society.
Female respondents were more evenly split across the categories, with about a third either nervous, neutral, or excited. Males were heavily skewed to excited, with only about a quarter of respondents in each of the other two categories.
Age
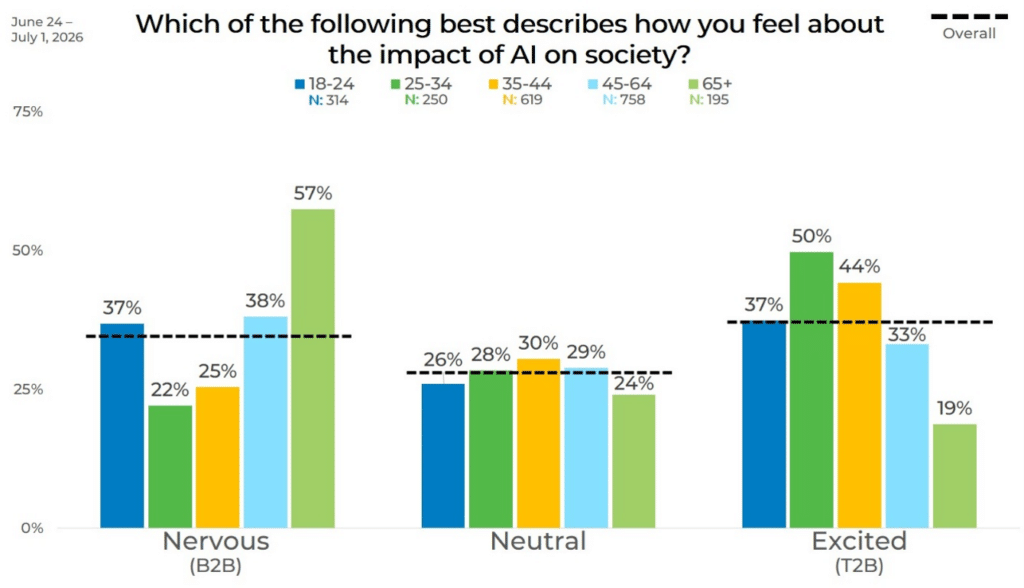
Segmenting the data by age uncovers some interesting insights. Respondents aged 18-24 and those 65+ are the most nervous about AI’s impact on society. On the flip side, respondents between 25 and 44 are twice as likely to be excited as nervous.
Income
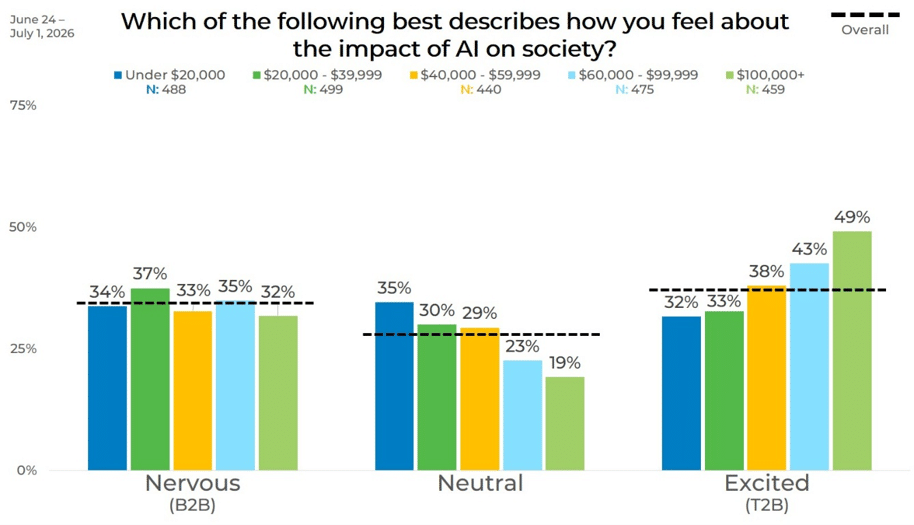
We found that excitement about AI’s impact on society increases as income increases, peaking at 49% with those with an income of $100,000+. Income level does not seem to have an impact on the number of respondents who are nervous, as it is fairly even across income levels.
Ethnicity
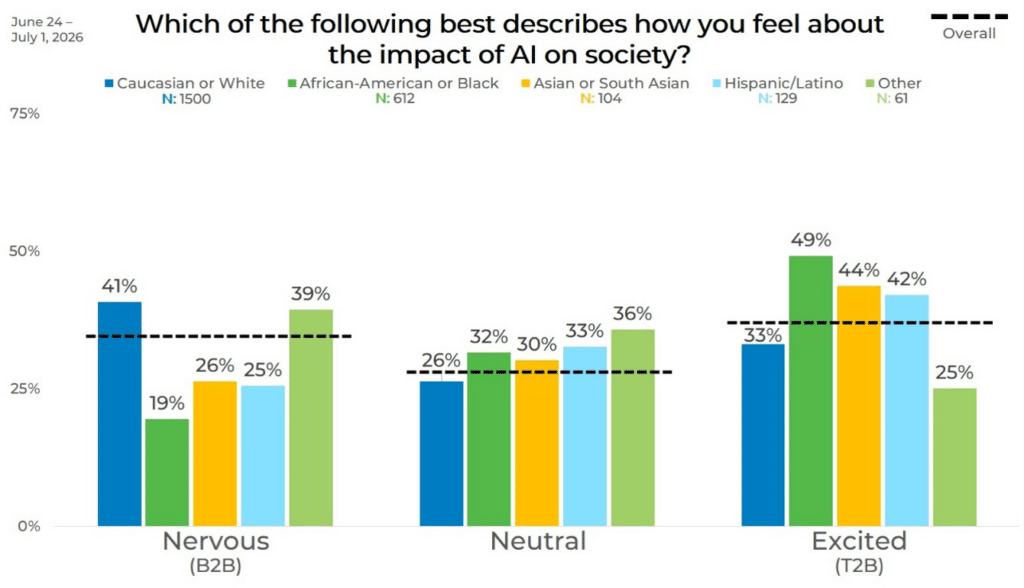
When we look at the data by ethnicity, we find that African Americans, Asians, and Hispanics are more excited about AI’s impact on society than they are nervous. The opposite is true for Caucasians, where 41% are nervous versus 33% who are excited.
Panel
Breaking down the data by panel highlights substantial differences among panel sources. There are twice as many respondents from Panel A who are nervous about AI’s impact as there are who are excited.
Panel Q has between 10% and 17% more respondents who are neutral than the other panels.
Panels E, I, and J have a very similar number of respondents excited about AI’s impact on society, but they differ in the percentage of respondents who are nervous versus neutral.
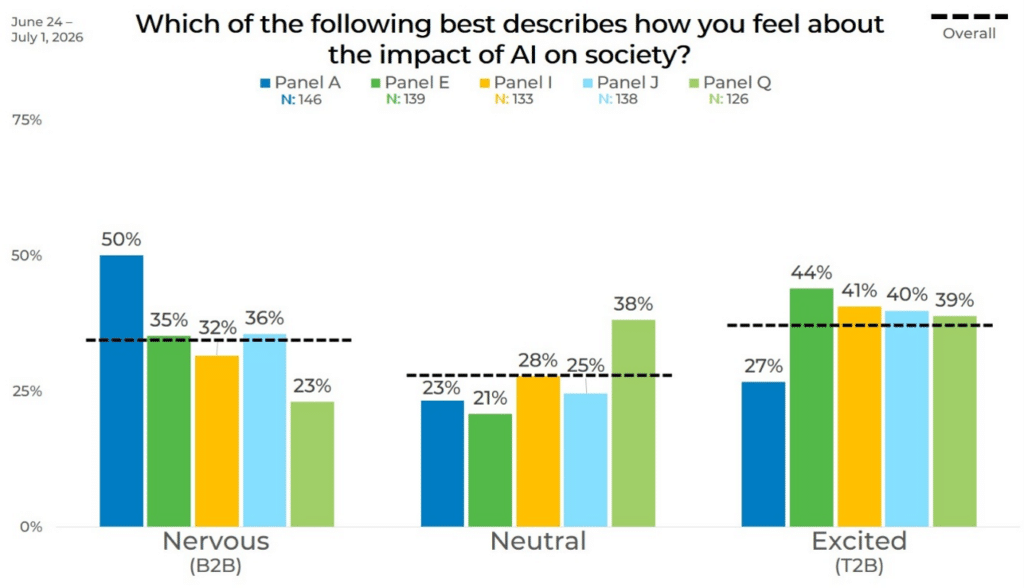
The data highlights the need to strategically blend your sample sources when conducting online quantitative research. If you blend a group of panels that are not complementary, you increase the amount of sample bias you introduce into your data.
Click the button below to learn how we can help you mitigate sample bias in your next study.