
All Talk or All Ballots? How Many Americans Plan to Vote in the 2026 Midterms
October 26, 2026Democrats Seem to Have the Edge, But the 2026 Midterms Aren’t Over Until the Ballots Are Counted
Every election season brings a fresh wave of polls, predictions, and pundits confidently explaining what’s going to happen. The 2026 midterms are no exception. With control of Congress on the line, generic ballot polling has become a closely watched indicator of which party may have the upper hand. But national headlines only tell part of the story. Voting preferences can look very different depending on who’s answering the questions and, more importantly, who’s actually planning to vote.
In our latest research-on-research, we asked consumers who said they were likely to participate in the midterms which party’s congressional candidates they would support.
Let’s dig in.
Overall
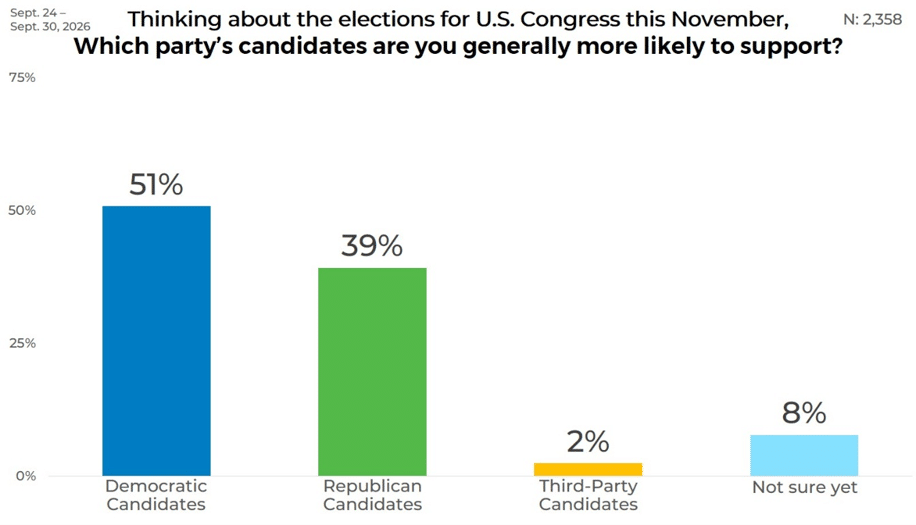
Among respondents likely to vote in November, 51% say they are generally more likely to support Democratic candidates, compared with 39% who say they are more likely to support Republican candidates. This represents a 12-percentage-point advantage for Democrats among the surveyed likely voters.
Gender
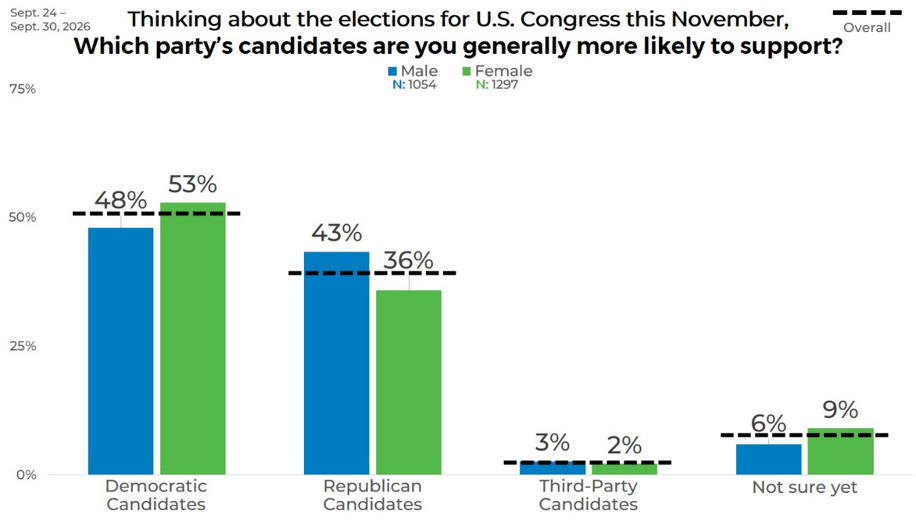
When we segment the data by gender, we see that women express a stronger preference for Democratic candidates than men, with 53% of female respondents favoring Democrats compared with 48% of male respondents. Republican candidates receive greater support among men (43%) than among women (36%).
Although Democrats lead among both genders, their advantage is considerably larger among women, at 17 percentage points, compared with just five points among men.
Age
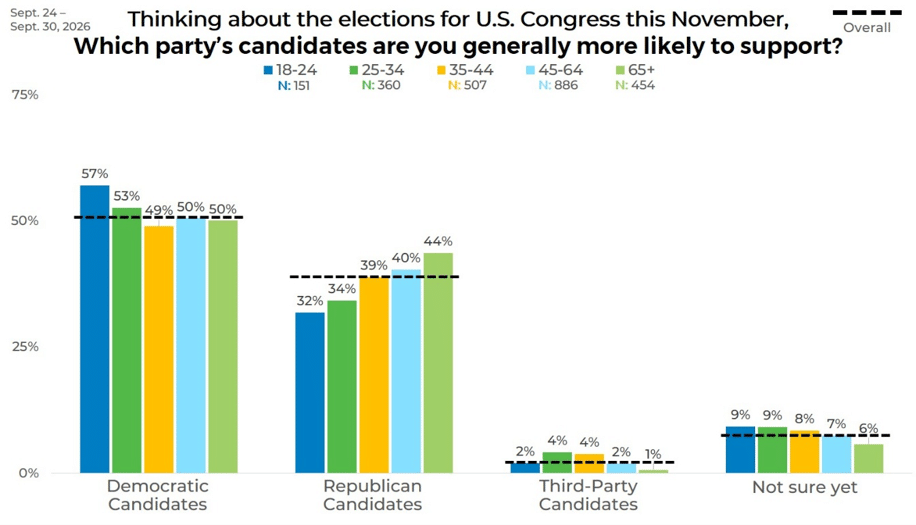
There are 2 definite trends we can see when we look at the data by age. Younger respondents generally express stronger preferences for Democratic congressional candidates, while Republican support tends to increase with age. Among adults aged 18–24, 57% favor Democrats compared with 32% supporting Republicans, a 25-percentage-point advantage. Adults aged 25–34 show a similar pattern, with 53% favoring Democrats and 34% supporting Republicans.
The gap narrows among older respondents. Adults aged 35–44 favor Democrats by 49% to 39%, while those aged 45–64 report 50% Democratic support and 40% Republican support. Among adults aged 65 and older, the difference is smallest, with 50% favoring Democrats and 44% supporting Republicans.
Income
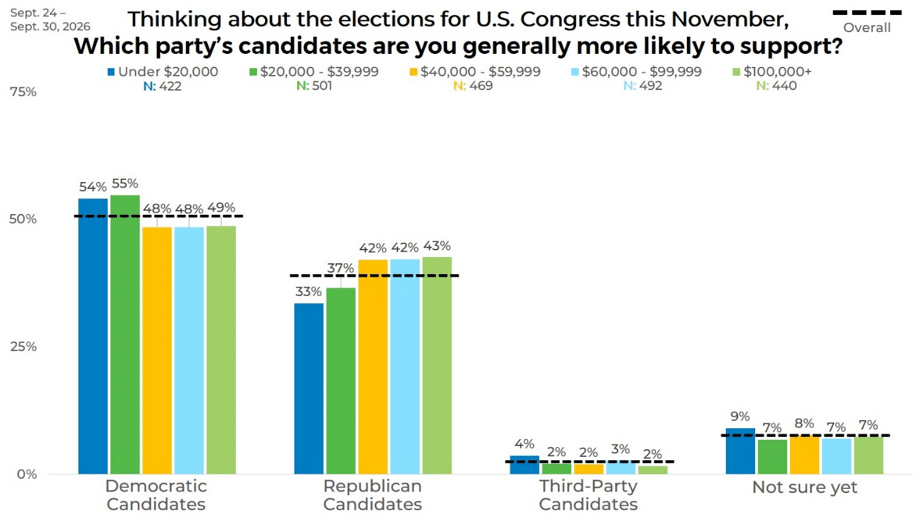
Democratic candidates lead across all household income categories, with their largest advantages appearing among lower-income respondents. Among those earning under $20,000 annually, 54% favor Democrats compared with 33% supporting Republicans.
The differences narrow among higher-income groups. Respondents earning $40,000–$59,999 and $60,000–$99,999 report identical preferences, with 48% favoring Democrats and 42% supporting Republicans. Among those earning $100,000 or more, 49% prefer Democrats compared with 43% favoring Republicans. Across the income categories, Republican support generally increases with income, while Democratic support remains between 48% and 55%.
Political Affiliation
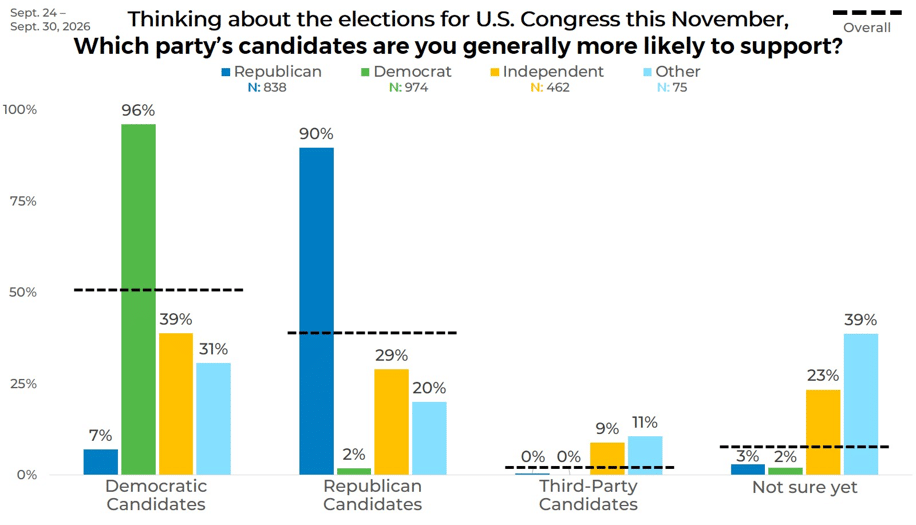
When segmenting the data by political affiliation, the strongest divisions in congressional candidate preferences are revealed. Among self-identified Democrats, 96% favor Democratic candidates, while 90% of Republicans prefer Republican candidates. Cross-party support is limited, with 7% of Republicans favoring Democrats and just 2% of Democrats favoring Republicans. Independents show more divided preferences, with 39% favoring Democratic candidates and 29% supporting Republicans.
Ethnicity
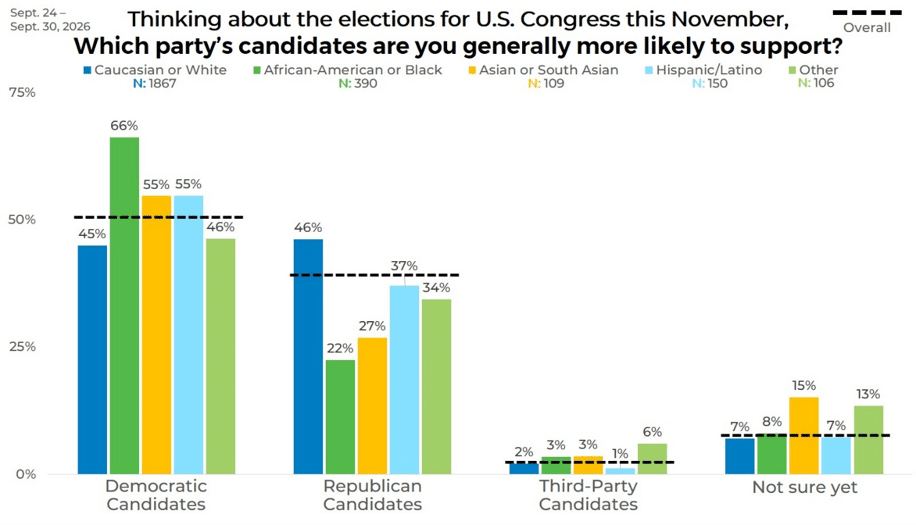
Congressional voting preferences vary noticeably across ethnicities. Black respondents report the strongest preference for Democratic candidates, with 66% favoring Democrats compared with 22% supporting Republicans, a 44-percentage-point difference. Asian respondents also favor Democrats by a substantial margin, at 55% compared with 27% for Republicans. Hispanic or Latino respondents report 55% support for Democratic candidates and 37% for Republicans. White respondents, by contrast, are nearly evenly divided, with 45% favoring Democrats and 46% supporting Republicans.
Panel
There were some significant differences when we segmented the data by panel source. The largest difference across survey panels appears between Panels D and X. Panel D is the only panel where Republicans lead, with 55% support compared with 38% for Democrats. Panel X shows the opposite pattern, with 63% favoring Democrats and 29% Republicans, creating a 25-point gap in Democratic support and a 26-point gap in Republican support between the panels.
The remaining panels favor Democrats by narrower margins. Panel H reports 50% Democratic support versus 38% Republican support, followed by Panel R at 49% versus 38% and Panel K at 49% versus 42%. Undecided preferences range from 5% to 9%, while third-party support peaks at 5% in Panel R, reflecting the range of preferences captured across panels.
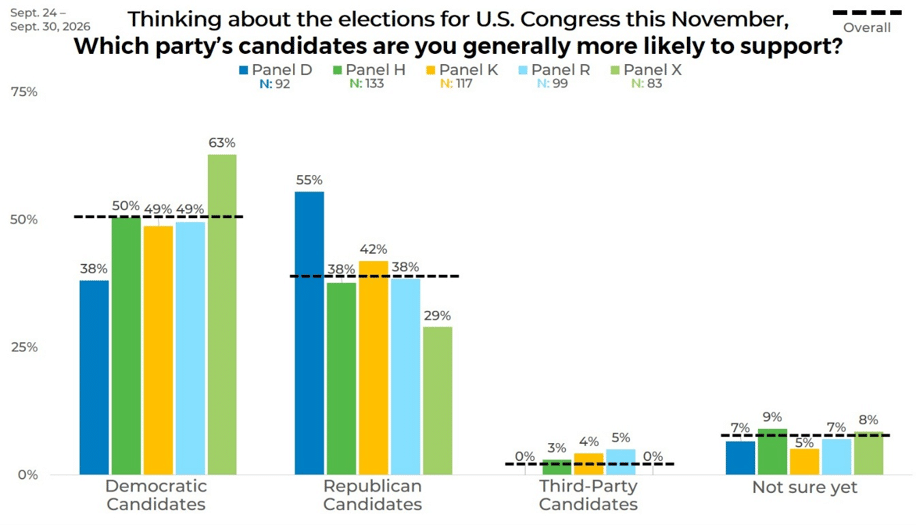
This data shows the need to strategically blend your sample to mitigate bias from your results. Otherwise, you could draw the wrong conclusion and make the wrong decision.
Find out how EMI can help you with your next study. Click the button below to schedule time with one of our expert sample consultants.