
Signed, Sealed, and Debated: Public Opinion on Trump’s Executive Orders
March 24, 2025What is Longitudinal Research?
April 1, 2025
Over the past six months, consumers have faced noticeable price shifts in both essentials and non-essentials. We wanted to better understand what spending categories consumers are experiencing the most significant impact.
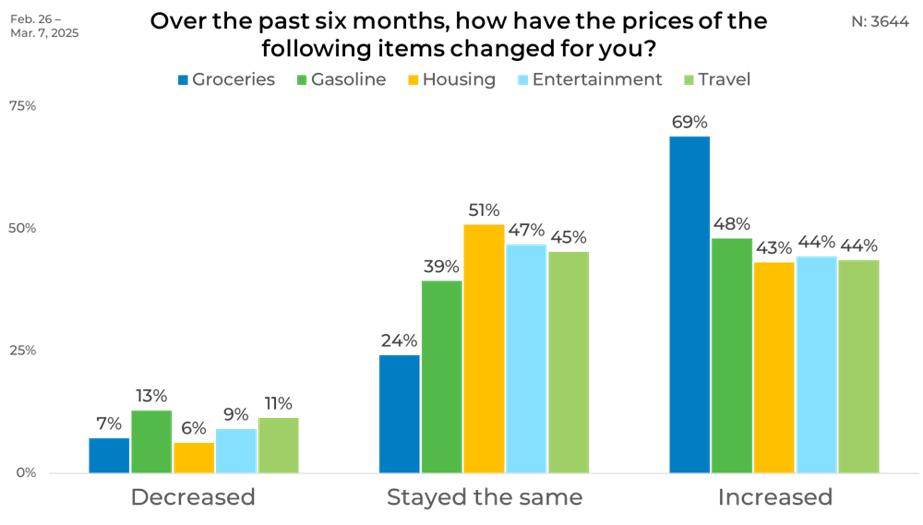
In our latest round of research-on-research, we asked consumers how prices have changed around five key categories. Using a five-point scale, we grouped responses into three categories: increased (top two boxes), decreased (bottom two boxes), and stayed the same.
Overall
Most respondents stated that grocery prices had increased for them over the last six months, far ahead of other categories. Gasoline, housing, entertainment, and travel saw similar levels, ranging between 43% and 48% of respondents. Notably, around half of respondents (51%) said housing costs stayed the same, making it the most stable category overall. Only a small portion of respondents reported decreases in prices.
Gender
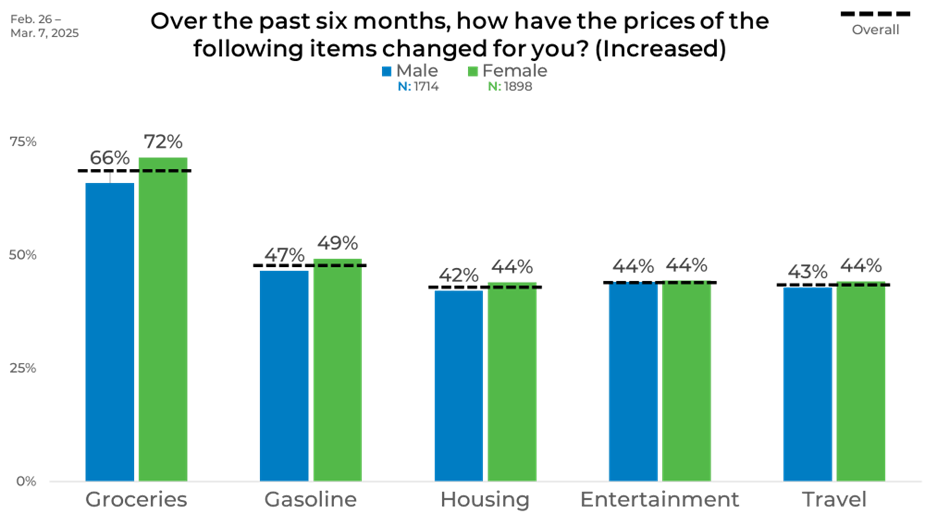
Regarding gender, women were likelier to report price increases across most categories. Seventy-two percent of women saw grocery prices rise, compared to 66% of men. Gasoline, housing, entertainment, and travel showed minimal gender gaps, though women consistently reported slightly higher levels of increase.
Age
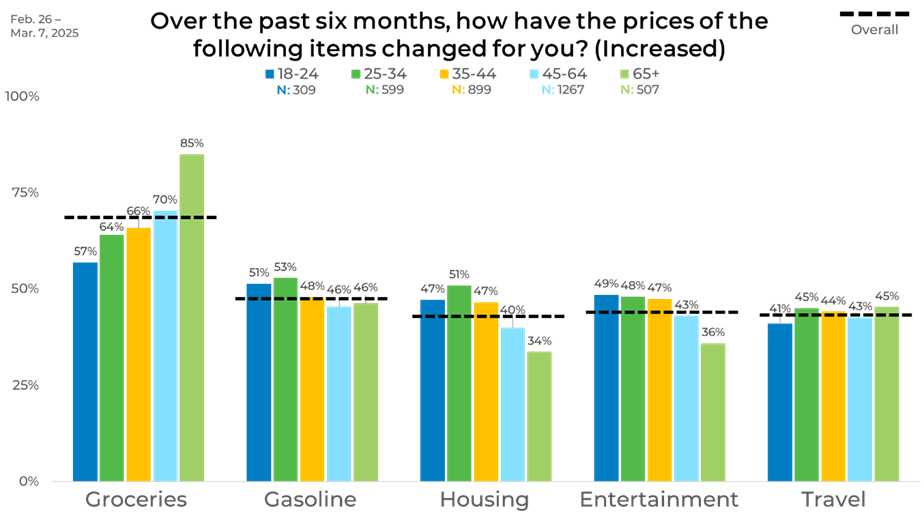
Age showed the most pronounced differences in reported price increases. Older adults, especially those 65 and up, were the most likely to report rising grocery costs (85%), a sharp contrast to 57% among those aged 18-24. However, the 25-34 age group was more likely to notice higher housing costs (51%) than older respondents. Entertainment price increases declined steadily with age, with younger adults more likely to report rising costs.
Income
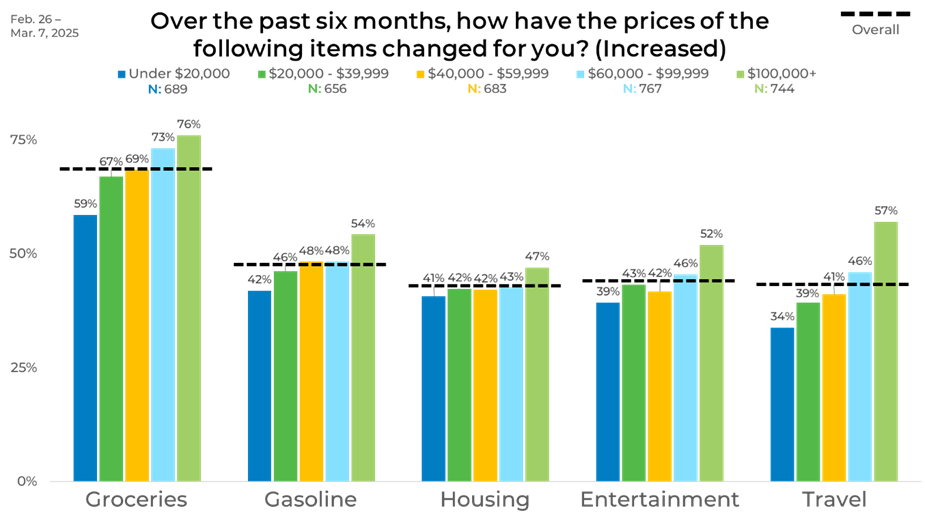
Looking at the data by income level uncovered some surprising insights about reporting price increases. Higher-income respondents were likelier to report rising costs in every category, especially groceries (76%) and travel (57%). In contrast, those earning under $20,000 had the lowest levels of reported price increases, particularly in travel (34%). Among age groups, those who reported increased prices with groceries climbed steadily with age, from 64% among those aged 25-34 to 85% among those 65 and older. Younger adults more commonly reported housing and entertainment increases, while travel remained relatively consistent across all age groups.
Region
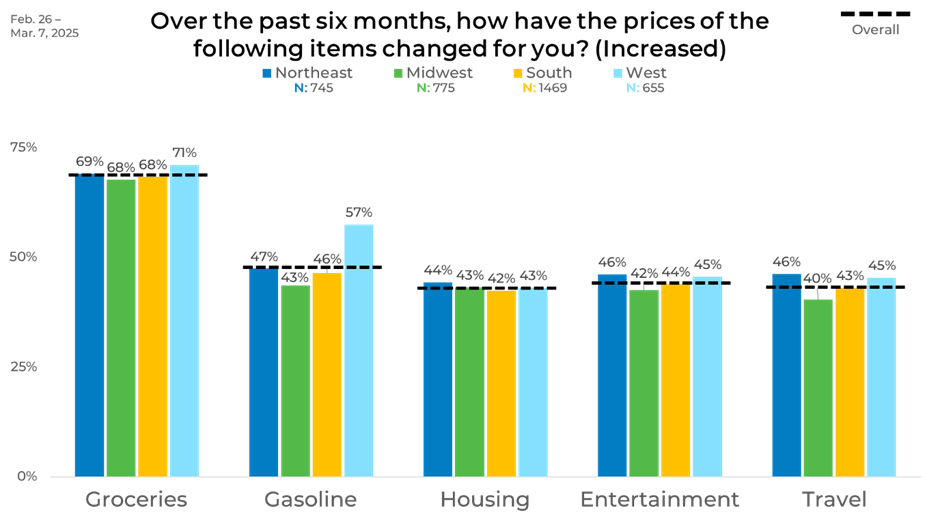
Regionally, grocery price increases were reported at the highest levels, especially in the West, with 71%. Gasoline saw the most considerable regional disparity, with the West again leading at 57%, compared to 43% in the Midwest. Entertainment and travel increases were reported fairly evenly across regions, with no standout highs or lows, indicating shared experiences regardless of location.
Ethnicity
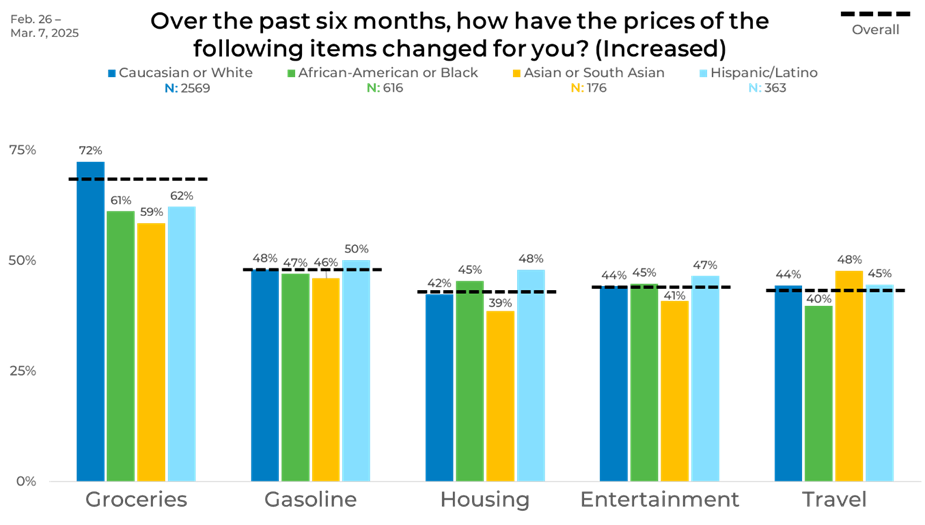
Cutting the data by ethnicity, we found that Caucasian respondents were most likely to report an increase in grocery prices (72%), followed by Hispanic/Latino (62%) and African American (61%) respondents. Asian and South Asian respondents reported the lowest grocery increases at 59%. Housing stood out among Hispanic/Latino respondents, 48% of whom reported price increases, the highest across all groups. African American respondents followed at 45%, while Asian and South Asian as well as Caucasian respondents were slightly lower. For entertainment and travel, the differences were modest—ranging from 39% to 48%—pointing to relatively similar experiences across ethnic lines in these categories.
Panel
Looking at the data by panel underscored how responses vary by source. For groceries, all panels hovered close to the 70% of respondents mark. However, housing showed a 21-point spread, ranging from 34% of respondents in Panel A to 55% of respondents in Panel P. Entertainment spanned from 33% to 58%, and travel ranged from 40% to 53%, indicating a 25- and 13-point difference, respectively.
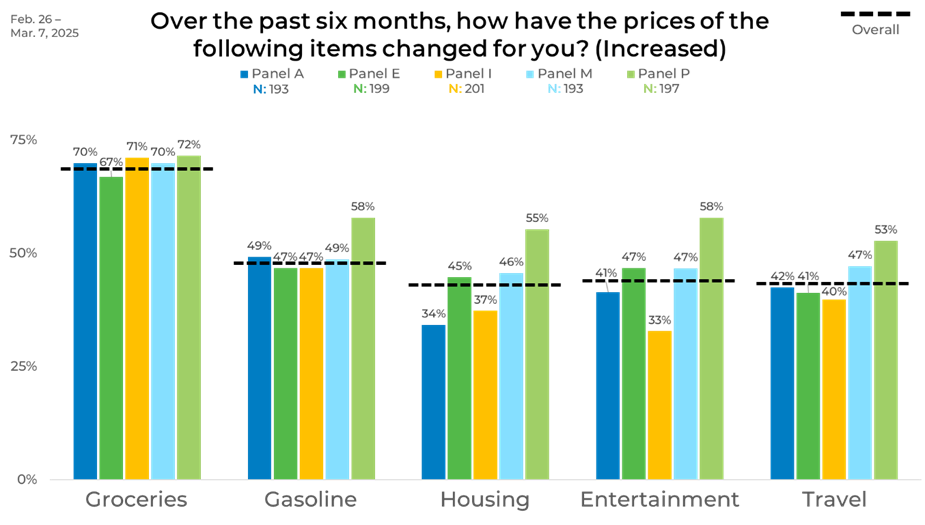
These variations highlight how panel composition can influence the magnitude of reported change. Blending these panels helps balance out individual biases, leading to a more accurate and comprehensive view. To learn more about our strategic sample approach, click the button below.


