

Hitting the Store or Hitting the Couch: 2023 Trends in Black Friday Shopping
November 17, 2023
Stay on the Sidelines or Take an Active Role: Views on U.S. Involvement in the Israel/Palestine Conflict
November 27, 2023
As fall starts to give way to winter, a beloved American tradition is ushered in: Thanksgiving. This holiday is not just about the joy of gathering but also about the delicious meals that bring us together. Curious about America’s favorite Thanksgiving dishes? We ask this very question in our most recent wave of research-on-research. Exploring choices from the classic turkey to the classic sides like the much-loved mashed potatoes, this study uncovers what really makes it to the heart of the Thanksgiving feast. Let’s dive into these tasty findings and find out the favorite flavors and dishes that make up our Thanksgiving celebrations.
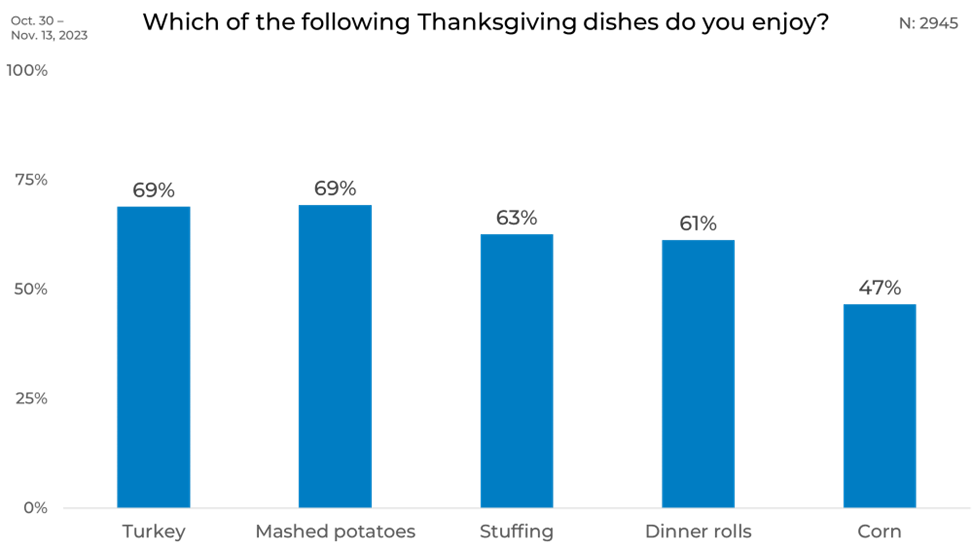
Overall, there was a resounding preference for turkey and mashed potatoes, cherished by 69% of respondents. This robust affection for these staples contrasts sharply with the more modest allure of corn, a dish favored by only 47%. The 22% gap in preference between these classics and corn paints a vivid picture of America’s Thanksgiving palate.
Gender
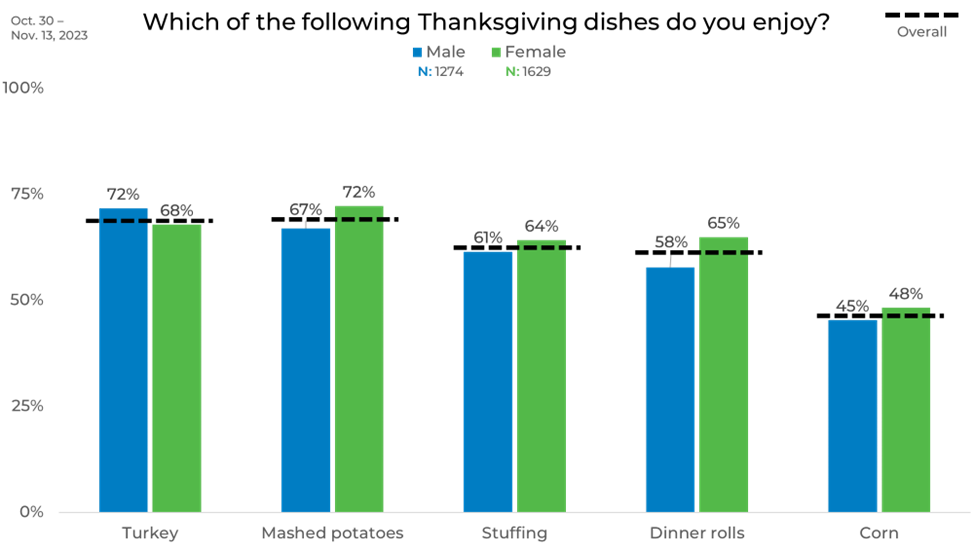
Delving into the gendered nuances of Thanksgiving preferences, we uncover distinct tastes. Men show a slightly stronger preference for turkey, leading by 4%. However, women take the lead in their fondness for the sides, whether it is dinner rolls, mashed potatoes, stuffing, or corn.
Age
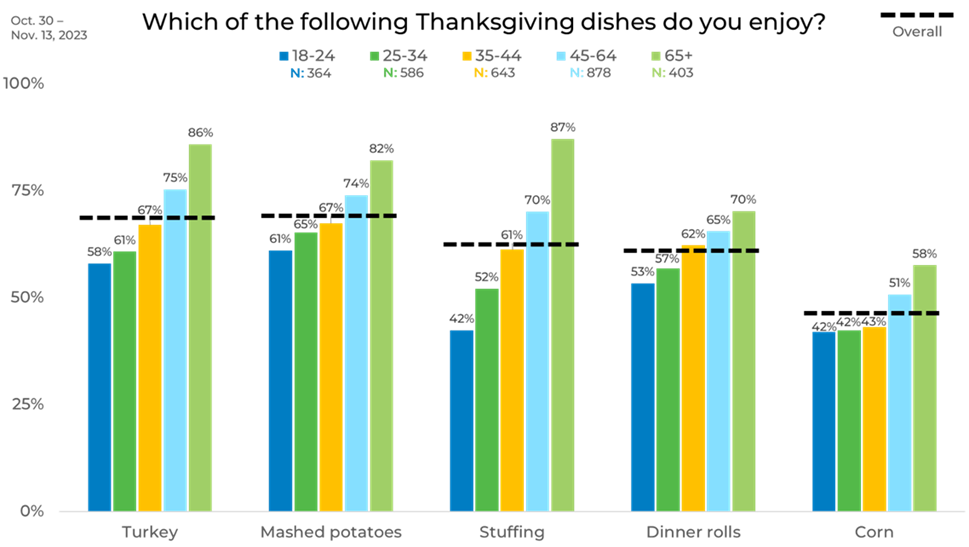
Age is a significant factor in determining food preferences. Older individuals, especially those aged 65 and above, are more likely to enjoy all the dishes surveyed. Compared to the 18-24 age group, the older generation is 28% more likely to enjoy turkey, 21% more likely to enjoy mashed potatoes, and a substantial 45% more likely to enjoy stuffing. Though having the least variance across age groups, corn remains the least liked on average.
Income
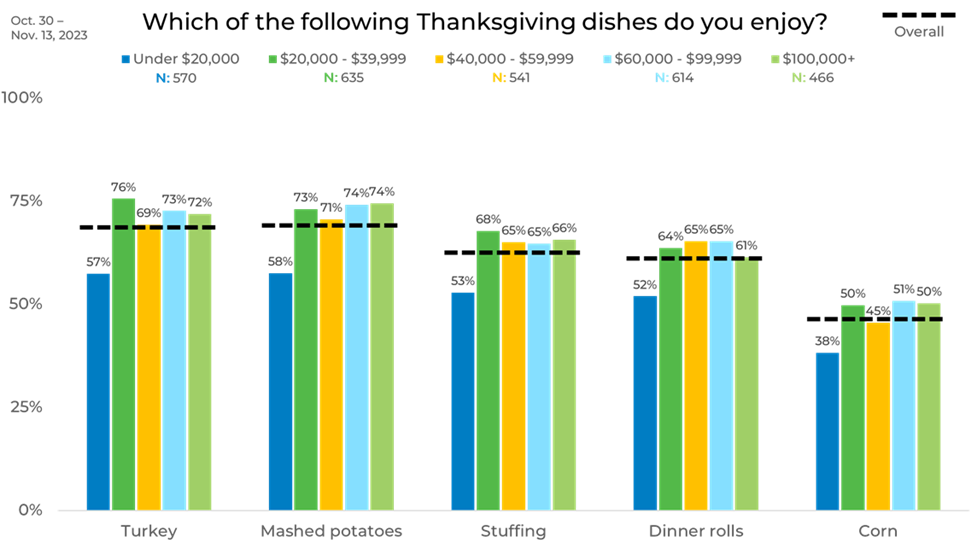
Income levels also play a role in Thanksgiving dish preferences. Those with incomes below $20,000 are 12% less likely to enjoy turkey and 13% less likely to enjoy mashed potatoes compared to other income groups. However, people earning between $20,000 and $39,999 show an 18% higher preference for turkey.
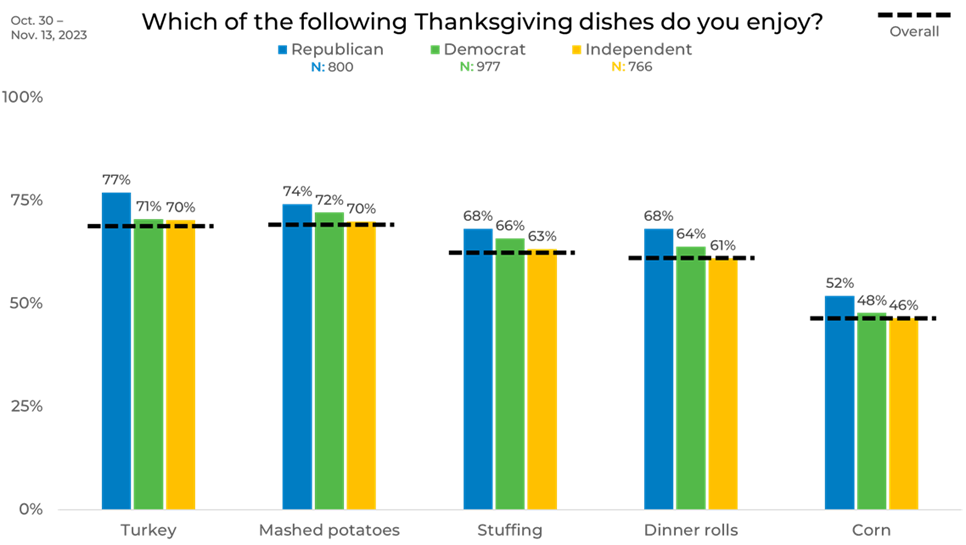
Political Affiliation
Thanksgiving dishes even echo political leanings. Republicans show a pronounced preference for all the dishes surveyed, particularly turkey, where their enjoyment surpasses Democrats by 6%. On the other hand, Independents show a markedly lower enthusiasm for these dishes, underscoring how political affiliations might subtly influence culinary choices.
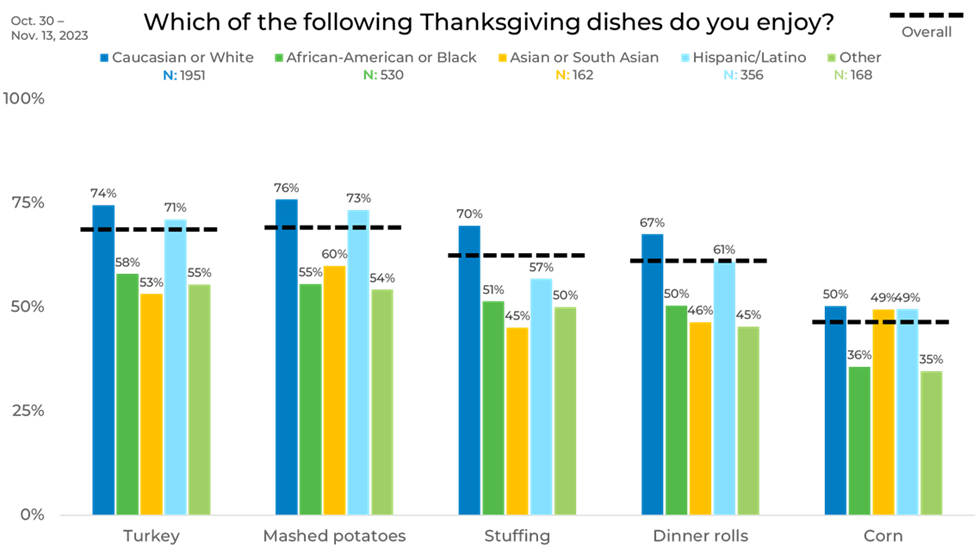
Ethnicity
Ethnic background influences Thanksgiving preferences as well. Caucasians are most likely to enjoy all the surveyed dishes, followed by Hispanics/Latinos. Caucasians are 25% more likely than Asians or South Asians to like stuffing and 22% more likely than other ethnicities to like mashed potatoes. This highlights how cultural backgrounds can affect our food choices.
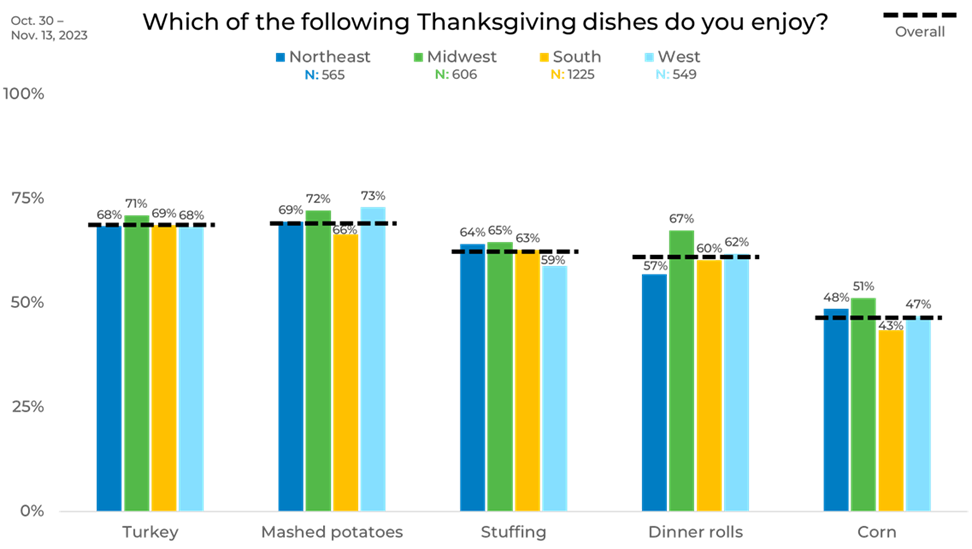
Region
Our study also uncovered regional variations in Thanksgiving preferences. There’s a small 4% variance in the preference for turkey across different regions. People in the Midwest and the West are the most likely to enjoy mashed potatoes, while those in the South are 3% less likely to prefer them. The Midwest shows a particularly strong liking for dinner rolls, 10% more than in the Northeast, and for corn, 8% more than in the South.
Panel
Finally, the choice of sample panels can significantly impact the results. Panel D was the least likely to enjoy all the Thanksgiving dishes, while Panel C showed the highest overall liking. The largest difference was observed in turkey preferences, with Panel C being 29% more likely to enjoy it than Panel D.
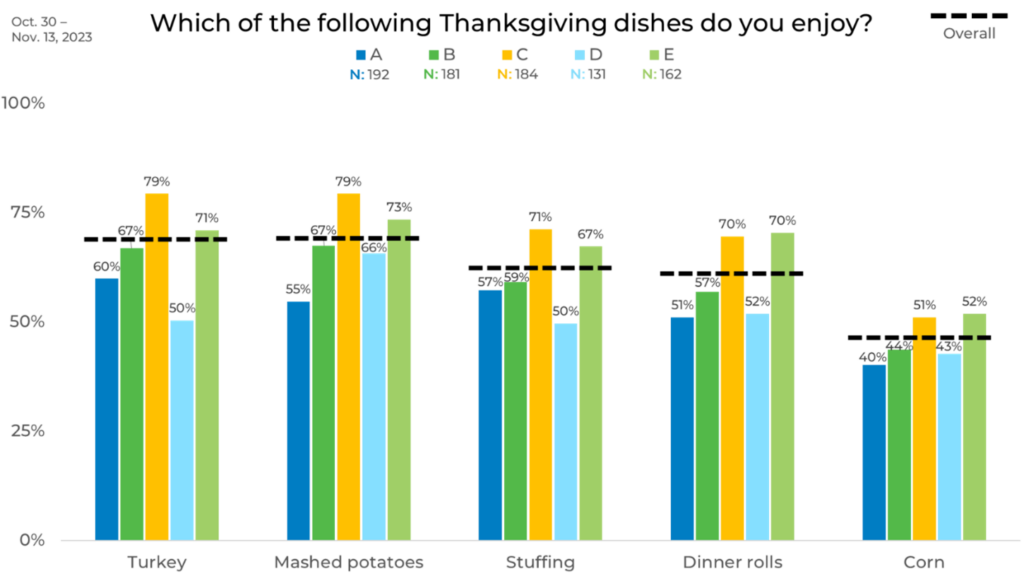
As you can see, attitudes and behaviors can vary greatly by both demographic and panel. This can have a significant impact on your data. For instance, if someone used Panel C and Panel E for their research, their results would be significantly higher if they had used Panel D and Panel A – possibly leading to a different business decision. This is why strategic sample blending is the best practice to ensure any changes in your data are due to shifts in the market, not any biases individual panels may have.
Learn more about panel differences in our annual report on the sample industry, The Sample Landscape: 2023 Edition.

