

Pumpkin Spice: Overrated or Celebrated?
November 14, 2023
Filling Up the Thanksgiving Plate: Preferences Around Traditional Thanksgiving Dishes
November 20, 2023
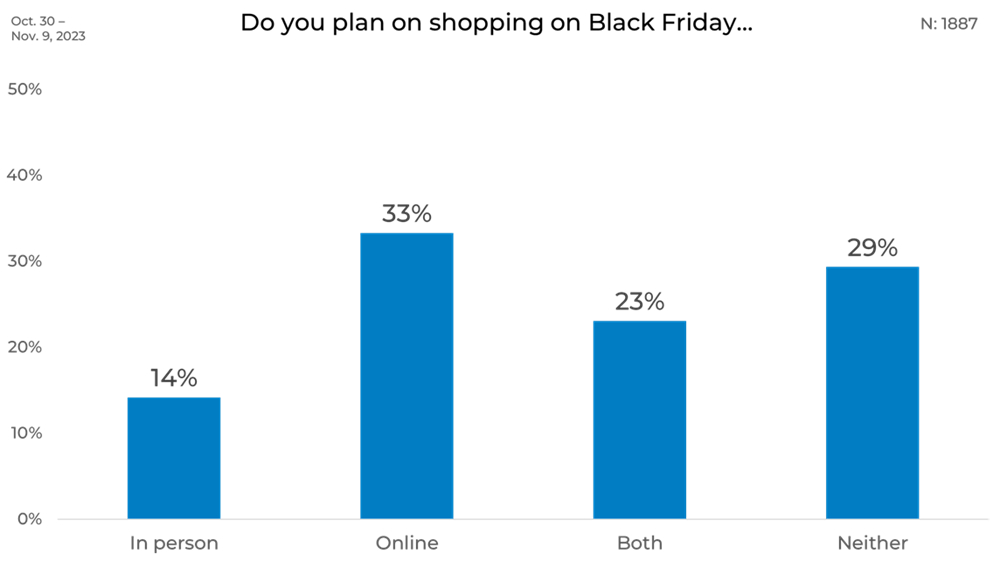
We are one week away from the unofficial start of the holiday shopping season. While this year it seems like many retailers have started their Black Friday sales early, the day after Thanksgiving is still a day many deal seekers eagerly await. In our recent round of research-on-research, we wanted to find out what people’s Black Friday plans were.
Overall, online shopping is the preferred choice for 33% of those surveyed, indicating a strong favor for the comfort and ease of internet purchases, combined with the additional 23% that plan to shop online and in-person, 56% of respondents plan to do some online shopping this Black Friday. Additionally, nearly a third of respondents say they are opting out of Black Friday shopping altogether.
Gender
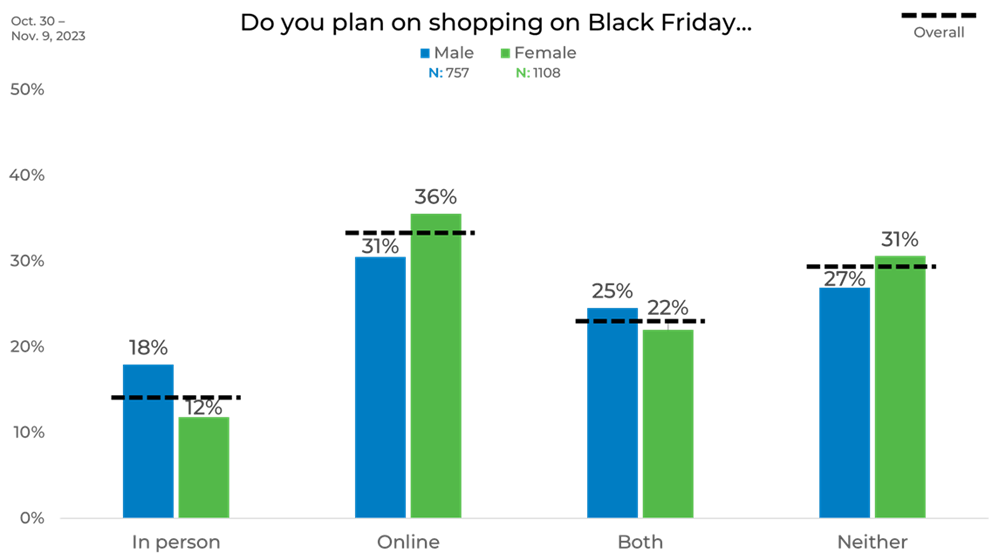
When Black Friday shopping plans are broken down by gender, some notable differences emerge. Males seem to show a slightly higher inclination to take part in in-person shopping, with an 18% likelihood compared to females at 12%. On the flip side, females are more drawn to online shopping, with 36% indicating they’ll hunt for deals virtually, which is 5% more than their male counterparts.
Additionally, females appear marginally more inclined to bypass the shopping holiday altogether, with 31% opting out of Black Friday, which is 4% more than males.
Age
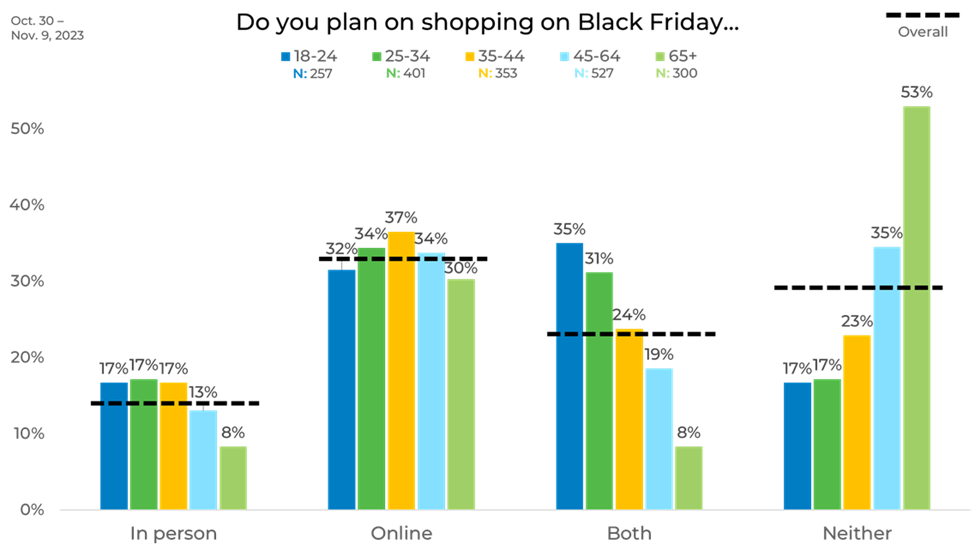
A clear trend emerges from the survey data when considering age groups and their Black Friday shopping plans. Younger individuals, particularly those between 18-24 years old, show a robust enthusiasm for the day’s activities, with a significant portion—35%—planning to shop both in person and online, which is 27% more than those over 65.
Conversely, as age increases, the likelihood of participating in Black Friday decreases. The data shows a notable pivot in the 65+ age bracket, where a majority—53%—intend to skip Black Friday shopping altogether. This is an 18% increase in non-participation compared to the next closest age group and a substantial 36% more than those under 34. It appears that the older demographics are less inclined to engage in the day’s consumer hustle, whether it be in-store, online, or a combination of both. This could reflect a range of factors from a preference for avoiding crowds to a diminished interest in the deals offered.
Income
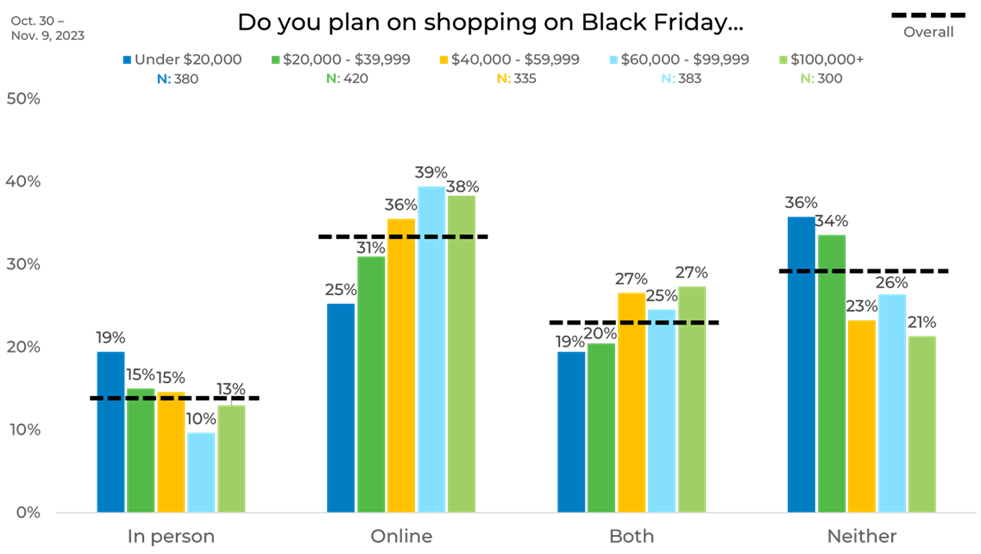
Income levels seem to influence Black Friday shopping preferences significantly. The survey data points out that those with incomes under $20,000 are the most inclined to shop in person, with 19% gearing up for the in-store experience, which is 4% more than any other income bracket.
A trend becomes apparent as we climb the income ladder: the propensity to shop online increases. Those earning between $60,000 and $99,999 show a marked preference for online shopping, with 39% planning to make their purchases via the Internet, which is 13% higher than those with incomes below $20,000.
Conversely, the lower income group is also the most likely to opt out of Black Friday shopping altogether, with 36% indicating they won’t be participating. This is a significant 15% more than those in the highest income bracket.
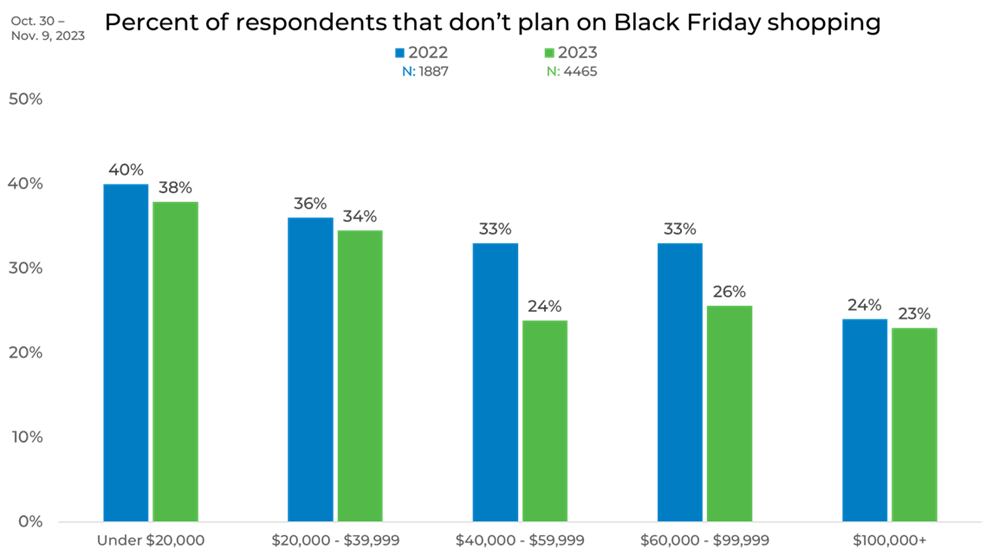
There seems to be a shift in consumer plans when compared to 2022 results. Across all income brackets, there is an uptick in the percentage of people who plan to engage in Black Friday shopping compared to last year.
Notably, the income group earning between $40,000 and $59,999 shows the largest change, with a 9% increase in those planning to shop this Black Friday compared to the last. Similarly, those with incomes ranging from $60,000 to $99,999 are also 7% more likely to participate in Black Friday shopping this year.
Political Affiliation
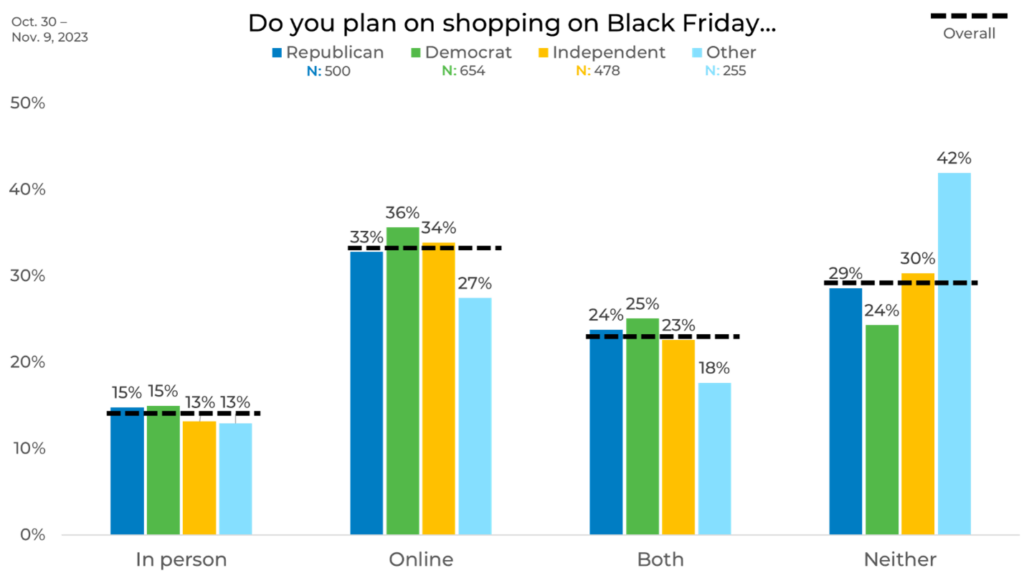
We found subtle variations when looking at the data by political affiliation. In-person shopping shows minimal differences across political parties, with a mere 2% variance, indicating a fairly uniform disinterest in hitting the stores.
When it comes to online shopping, Democrats are slightly more likely to shop than Republicans, with a 3% difference between them.
Ethnicity
Ethnicity also provides an interesting lens through which to view Black Friday shopping behaviors. The survey indicates that African Americans are the most likely to engage in in-person shopping, with 20% planning to hit the stores, closely followed by Hispanics/Latinos at 16%.
When it comes to online shopping, Asians or South Asians lead the preference, being 9% more likely than any other ethnic group to choose this option.
In terms of completely opting out of Black Friday, Caucasians and those classified under “Other” are the most likely to abstain from the day’s activities, with 34% and 39% respectively indicating they won’t participate. Conversely, Asians or South Asians are the least likely to sit out, with only 12% choosing not to engage in Black Friday shopping. This suggests a stark contrast in the likelihood of participating in Black Friday shopping between these groups, with Caucasians being 22% more likely than Asians or South Asians to avoid the event altogether.
Panel
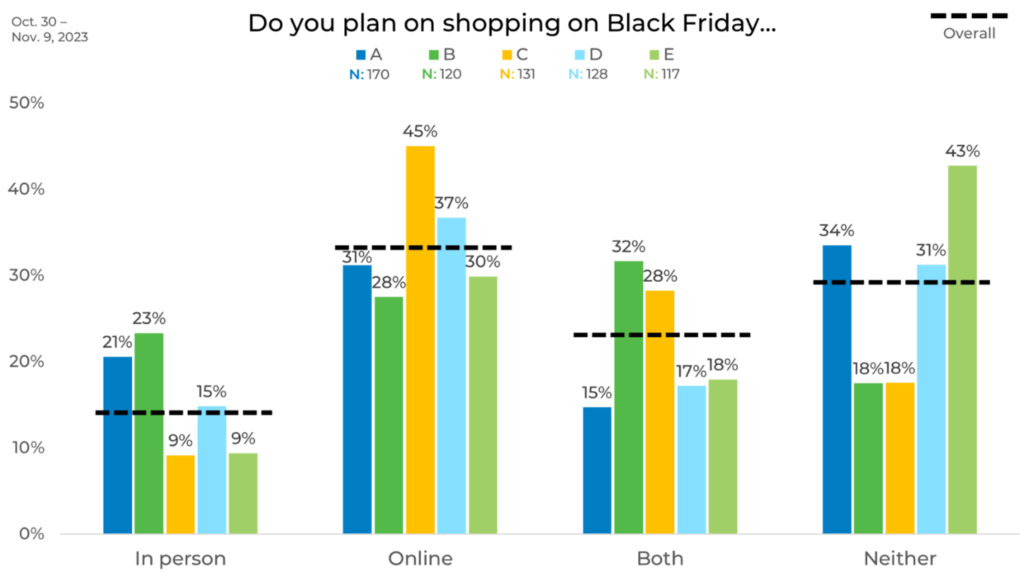
There were some compelling differences in Black Friday shopping preferences when comparing the data by panel. Panel A shows a clear tendency to avoid the Black Friday rush altogether or to turn to online shopping, while Panel B stands out as the group least likely to forgo the event.
Panel C’s respondents demonstrate a strong preference for online shopping, with nearly half, 45%, choosing to browse deals virtually. In contrast, Panel D’s respondents are split between preferring to shop online or not participating in Black Friday at all.
Panel E’s data is particularly striking; they have the highest percentage of respondents—43%—who are not interested in Black Friday shopping, which is 25% more than the least likely group, Panel B.
The stark contrast between Panels C and E encapsulates the diversity in shopping behaviors: one panel is almost evenly divided between those who shop online and those who don’t participate, while the other panel has a significant number of respondents who clearly prefer the online shopping experience. This variation underscores how consumer behavior can vary widely within different segments, potentially influenced by factors such as lifestyle, access to technology, or personal preferences regarding holiday shopping.
As you can see, attitudes and behaviors can vary greatly by both demographic and panel. This can have a significant impact on your data. For instance, if a brand only used Panel A or E to research Black Friday trends, the results would be significantly lower than if they used Panel C or B. This is why strategic sample blending is the best practice to ensure any changes in your data are due to shifts in the market, not any biases individual panels may have.
Learn more about panel differences in our annual report on the sample industry, The Sample Landscape: 2023 Edition.

