Intellicast S5E18 – Making Market Research More Inclusive With Tim Cornelius of QuestionPro and P3 Technology
May 31, 2022
Intellicast S5E19 – Growth-Focused Acquisition Strategies with Steve Schlesinger and Ted Pulsifer of Schlesinger Group
June 7, 2022We are in the middle of the primary season. So, where do we stand? To prepare for midterms this November, we’re looking at political affiliation, voter registration, and perceptions of America by demographic.
Political Affiliation
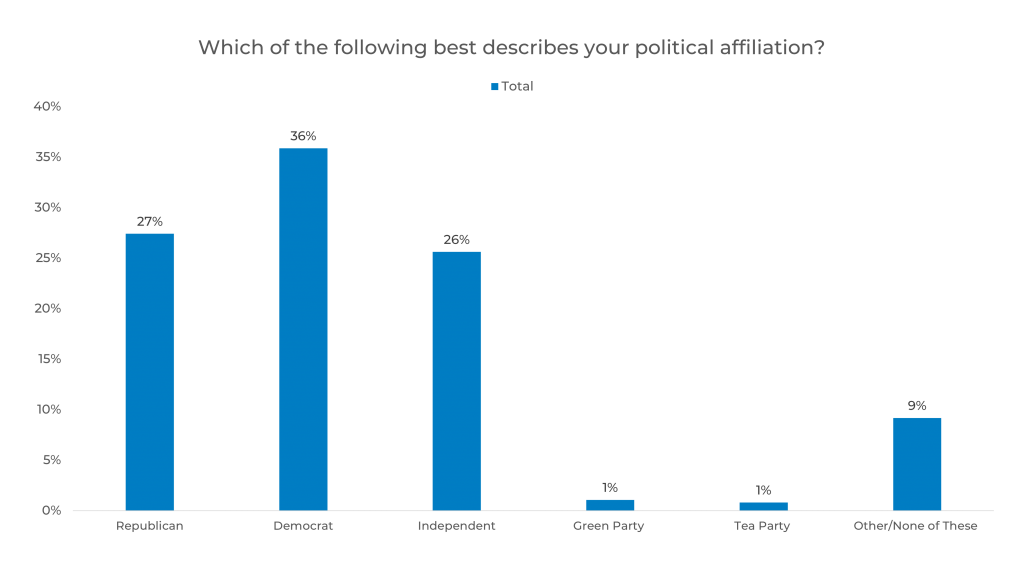
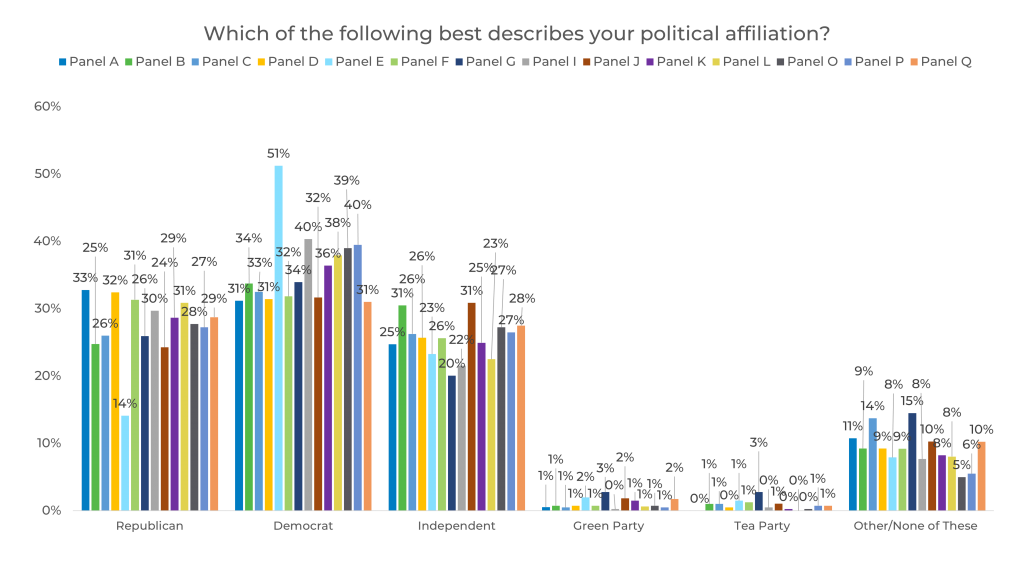
First, we looked at how respondents identify when it comes to their political affiliation. 36% identified as Democrat, 27% identified as Republican, and 26% identified as Independent.
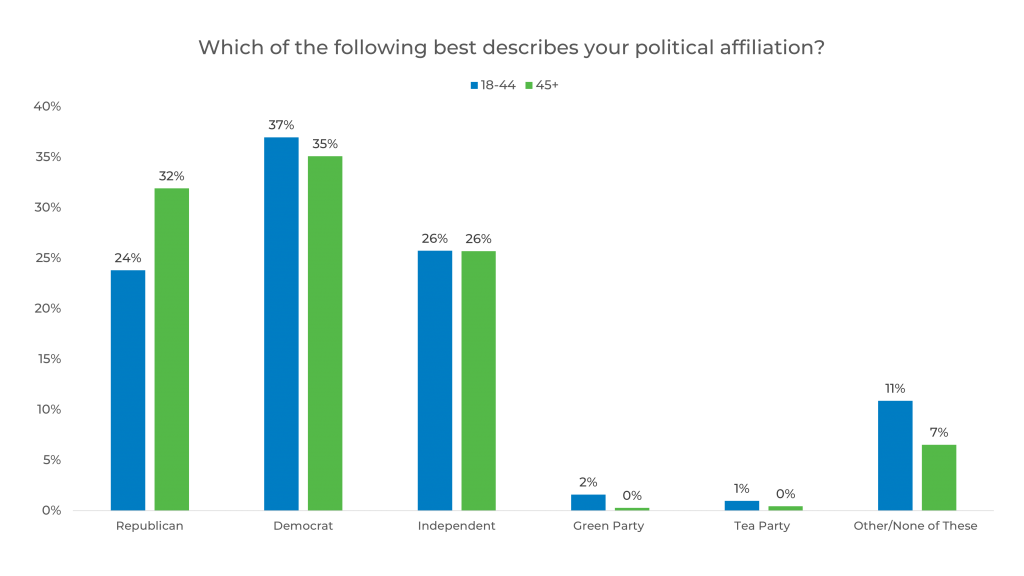
Next, we looked at political affiliation by age. Respondents aged 18-44 are most likely to identify as Democrat followed by Independent and Republican, respectively. Respondents age 45+ are most likely to identify as Democrat followed by Republican and Independent, respectively.
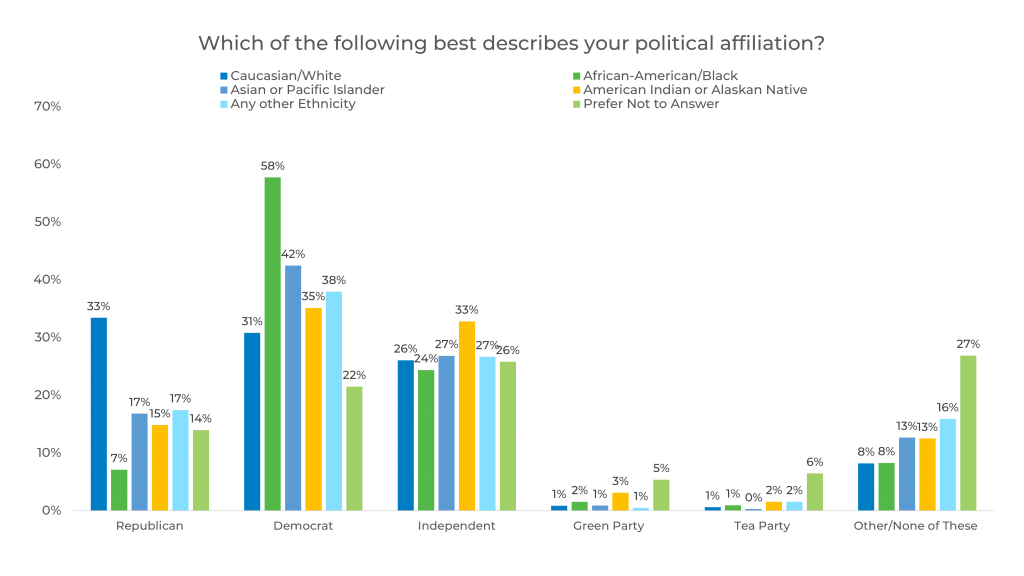
When looking at political affiliation by ethnicity, Caucasian/White respondents are most likely to identify as Republican. African American/Black respondents are most likely to identify as Democrat. American Indian or Alaskan Native respondents are most likely to identify as Independent.
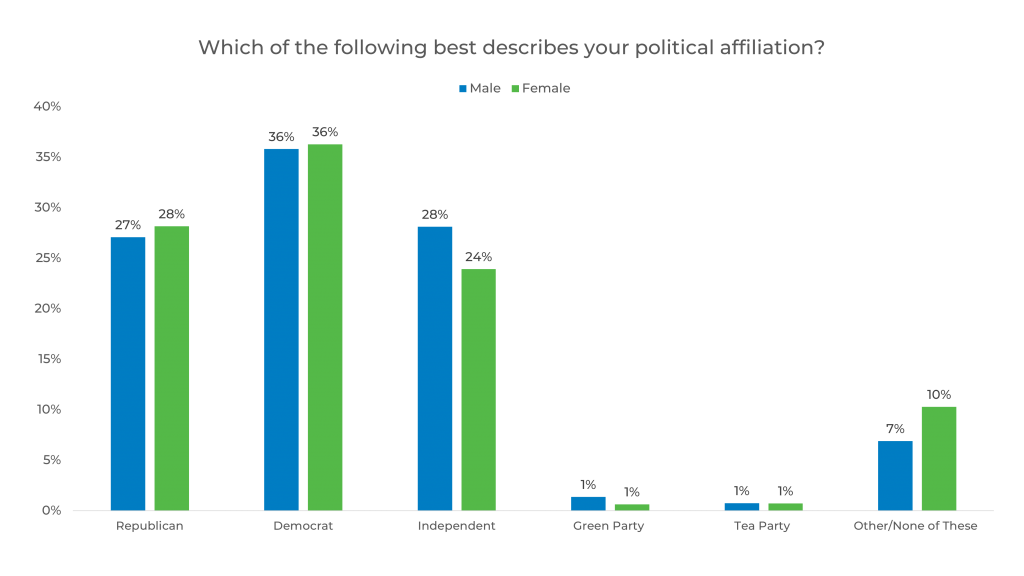
We don’t see a lot of difference in political affiliation by gender. Males are 4% more likely than females to identify as Independent and 3% less likely than females to identify as Other/None of These.
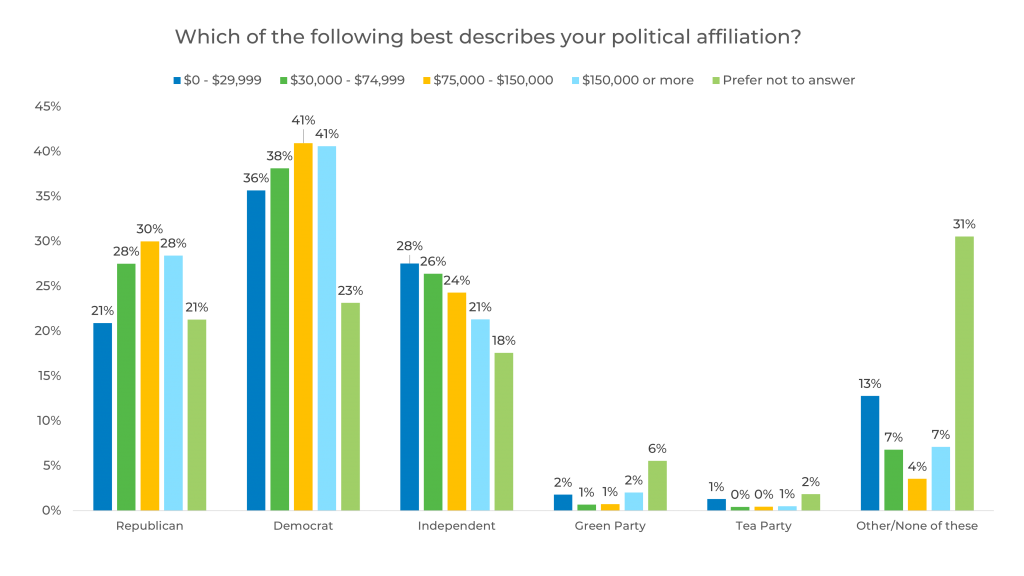
When it comes to income, respondents with incomes of $75,000-$150,000 are most likely to identify as Republican. Respondents with incomes of $75,000-$150,000+ are most likely to identify as Democrat. Respondents with incomes less than $29,999 are most likely to identify as Independent. Respondents who prefer not to answer are most likely to identify as members of the Green Party, Tea Party, and Other.
In terms of sample providers, we can see up to a 20% difference between panels as seen between Panels E and D in respondents who identify as Democrat.
Registered Voters
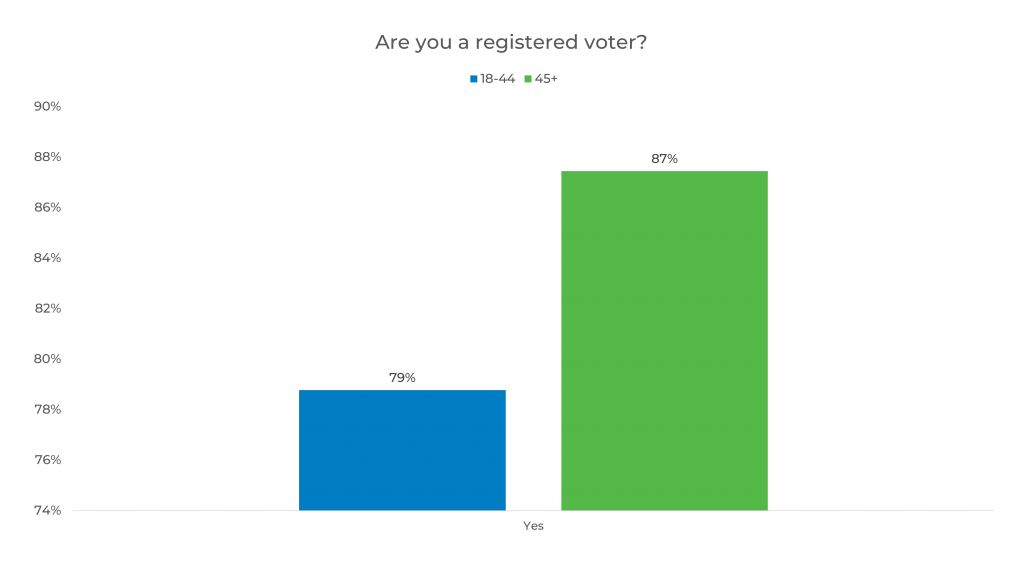
Overall, 82% of respondents are registered to vote. Respondents age 45+ are 8% more likely to be registered voters than those age 18-44.
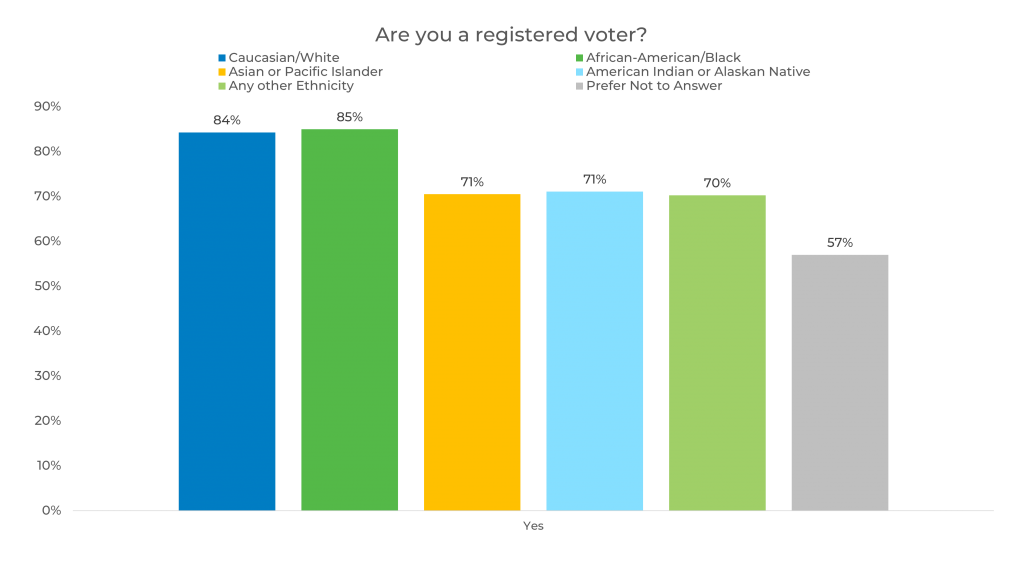
When looking at registered voters by ethnicity, Caucasian/White respondents and African American/Black respondents are most likely to be registered to vote followed by Asian or Pacific Islanders, American Indian or Alaskan Natives, those who identify as any other ethnicity, and those who prefer not to respond, respectively.
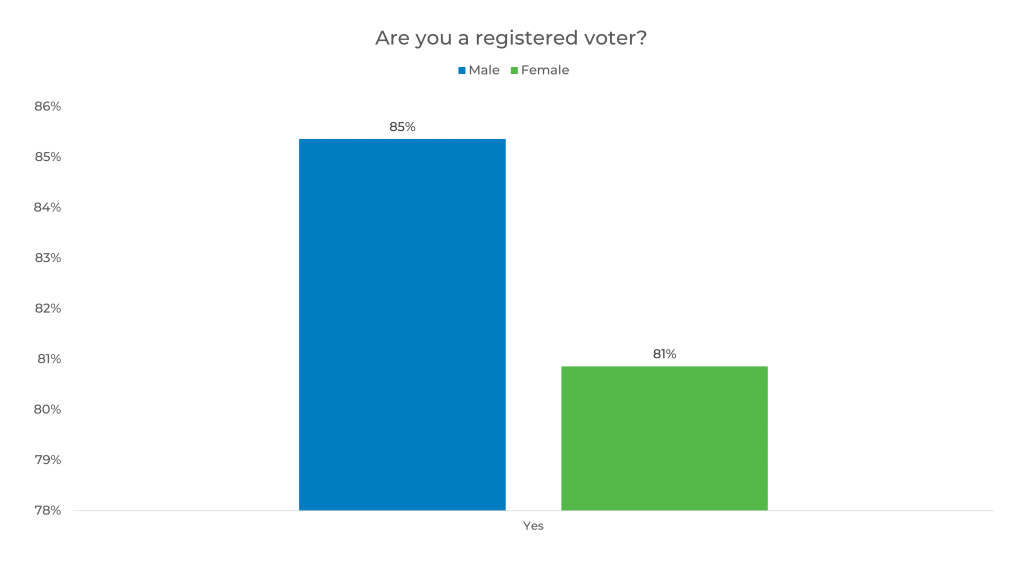
Males are 4% more likely to be a registered voter than females.
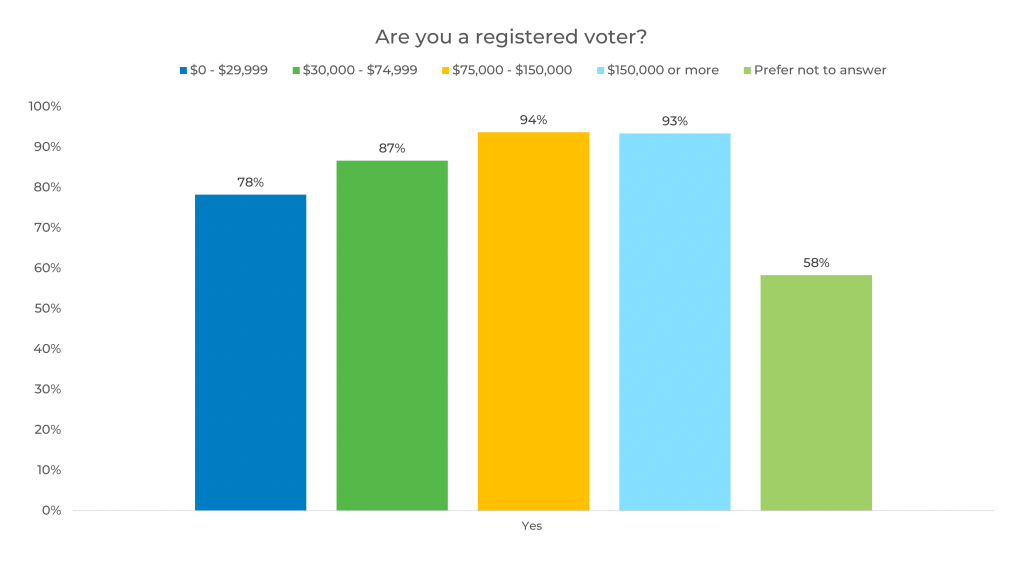
Respondents with incomes of $75,000-$150,000+ are most likely to be registered voters.
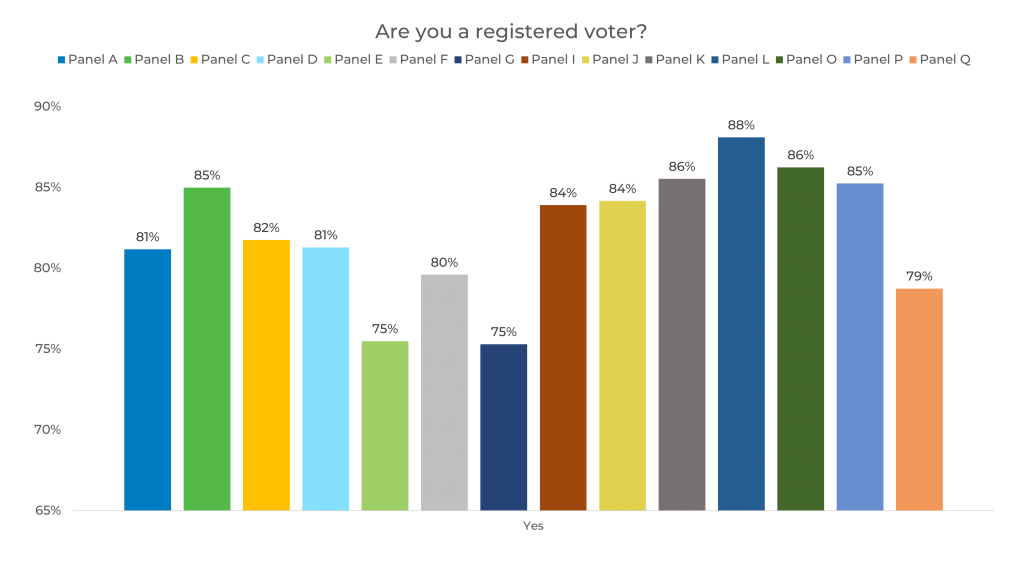
There is a 13% difference between panels in respondents who are registered voters as seen between Panels L and G.
Perceptions of America
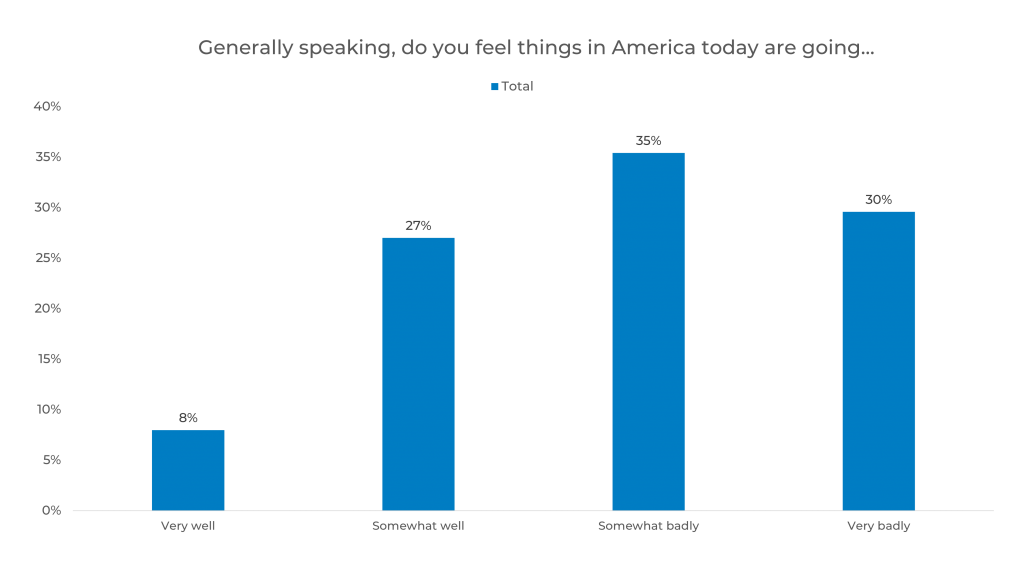
Overall, most people feel that things in America today are going somewhat badly or very badly. Only 8% of people feel that things are going very well.
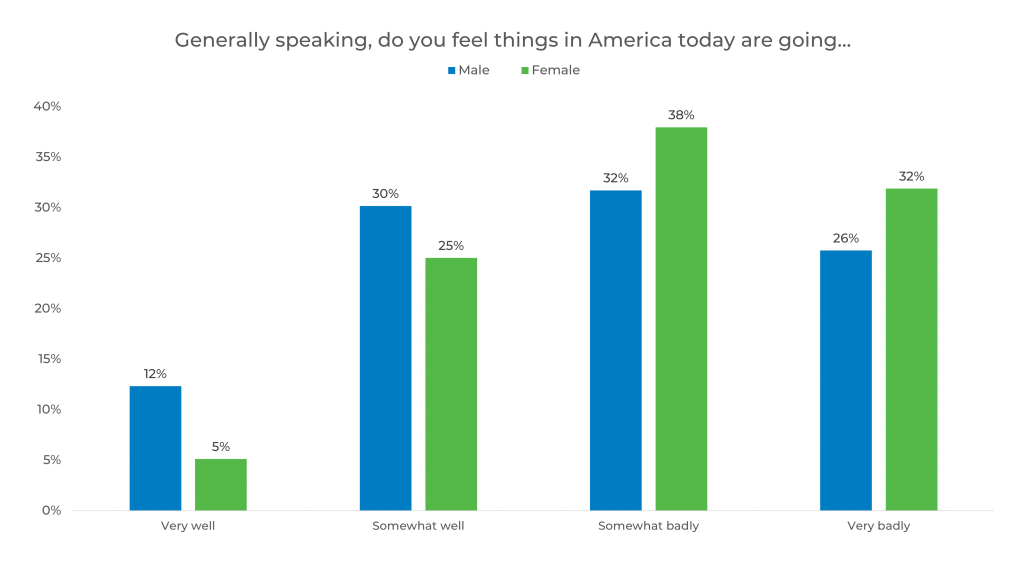
Females tend to believe that things in America are going badly more than males. Males tend to believe that things in America today are going well more than females.
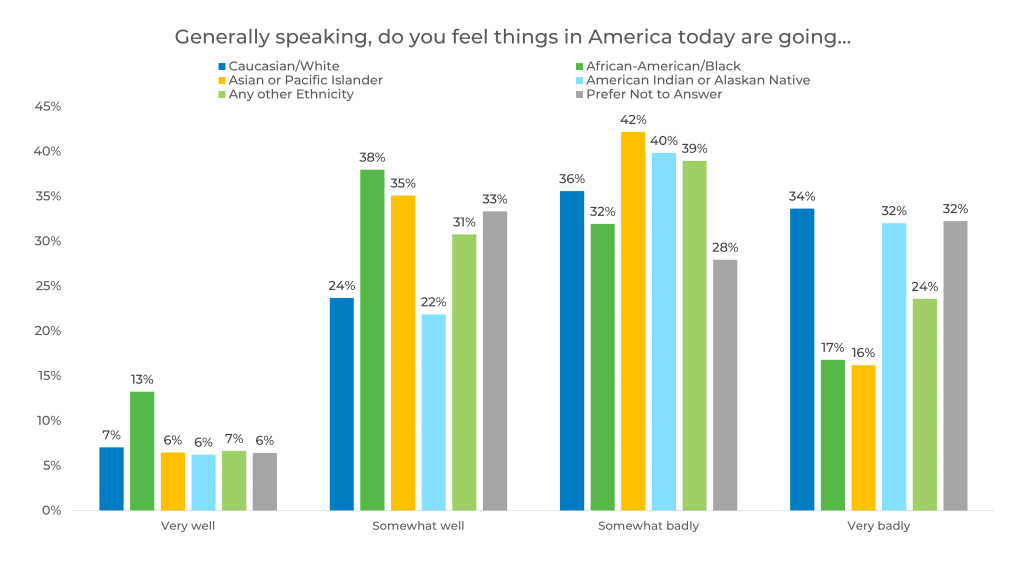
When looking at perceptions of America by ethnicity, African American/Black respondents are most likely to believe that things in America today are going very well. Caucasian/White respondents are most likely to believe that things in America today are going very badly.
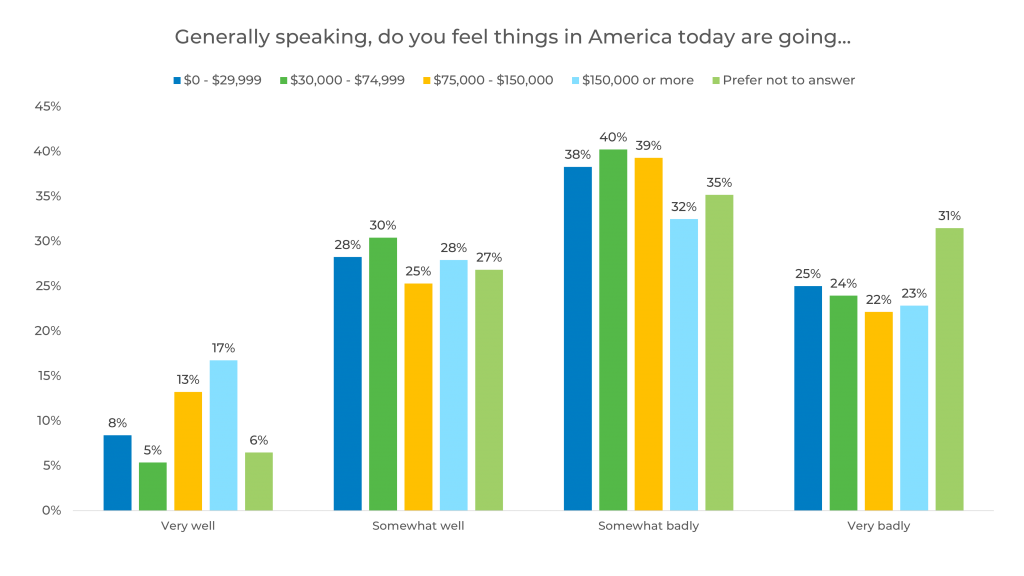
Respondents with incomes of $150,000+ are most likely to believe things in America today are going very well. Respondents with incomes less than $29,999 and those who prefer not to answer are most likely to believe things in America are going very badly.
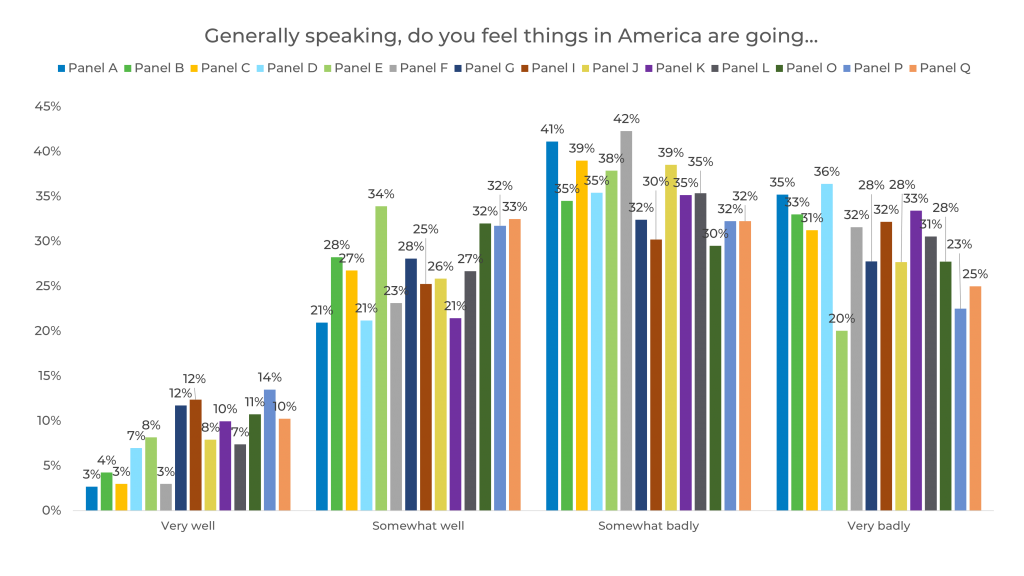
Here, we see up to a 16% difference between panels as seen between Panels D and E in respondents who believe things in America are going very badly.
Download your copy of The Sample Landscape: 2022 Edition to learn more about how panels differ! To learn more about the political landscape as we approach midterms, stay up to date with our blog.

