
AI, Fireworks, and Fraud
June 30, 2026
What’s on the Summer Agenda? How Americans Are Making the Most of Longer Days
July 9, 2026
The Fourth of July often brings together a familiar mix of public celebrations, outdoor gatherings, and time with family and friends. This data offers a snapshot of how Americans expect to spend the holiday, highlighting the activities that are most commonly anticipated and how those expectations vary across different groups.
Overall
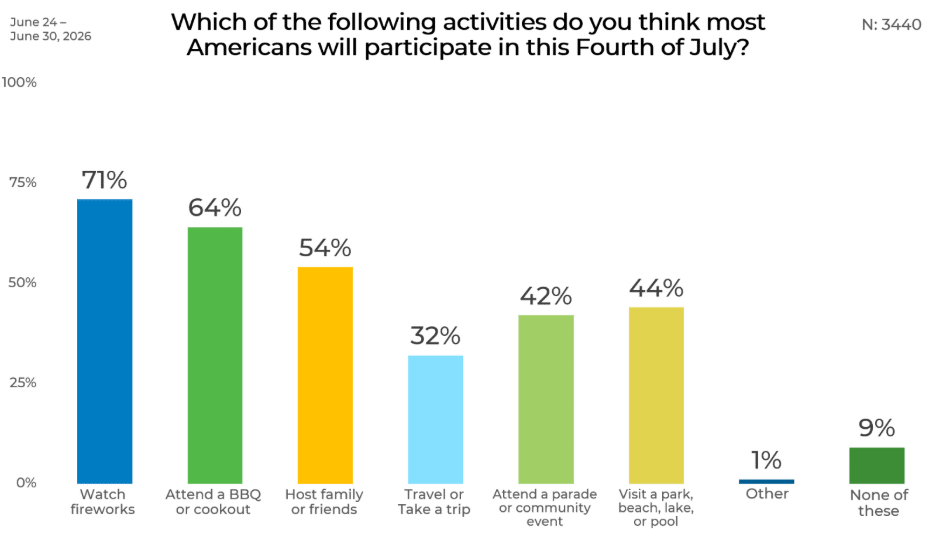
Overall, 71% say they think most Americans will watch fireworks this Fourth of July, making it the top activity in the survey. Attending a barbecue or cookout follows at 64%, while 54% expect Americans to host family or friends. These three activities stand apart as the most broadly anticipated parts of the holiday.
Outdoor recreation also plays a visible role, with 44% selecting a visit to a park, beach, lake, or pool. Attending a parade or community event is close behind at 42%, while travel or taking a trip is lower at 32%. Only 9% say none of these, and 1% selected another activity.
Gender
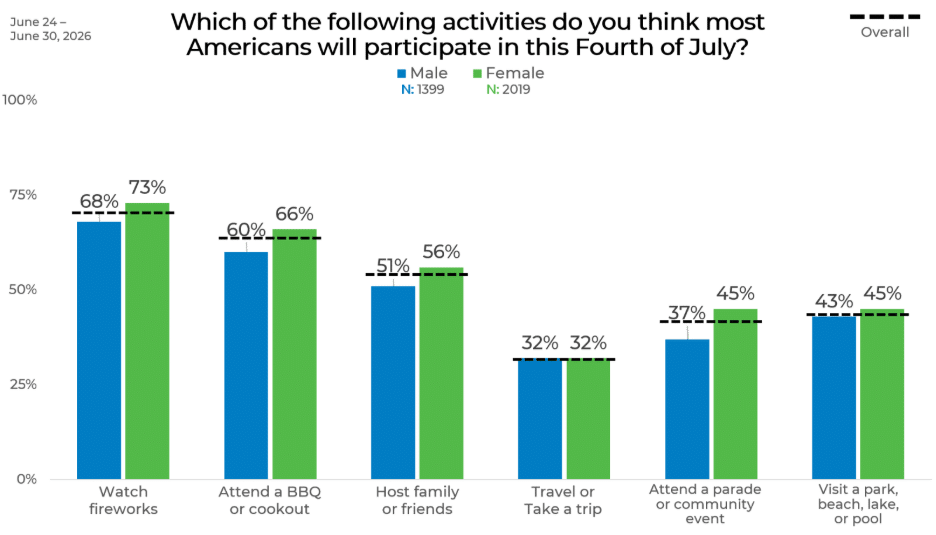
Women are slightly more likely than men to say most Americans will take part in several Fourth of July activities. The largest gender gap appears for attending a parade or community event, at 45% among women compared with 37% among men. Women are also more likely to expect fireworks viewing, at 73% compared with 68% among men, and barbecues or cookouts, at 66% compared with 60%.
The two groups are closely aligned on travel, with both men and women at 32%. Hosting family or friends is selected by 56% of women and 51% of men, while visiting a park, beach, lake, or pool shows only a small difference, at 45% among women and 43% among men.
Age
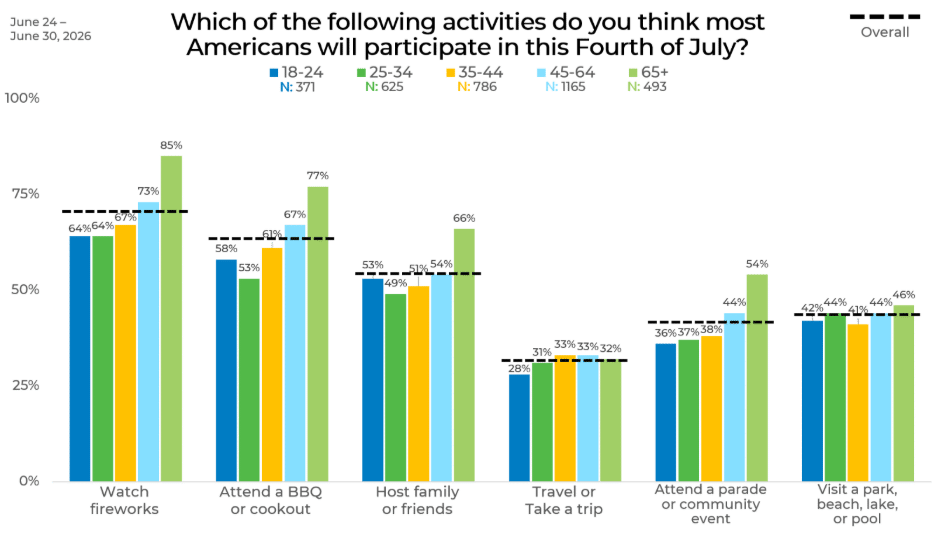
Age shows some of the clearest differences in the data. Adults 65 and older are the most likely to say Americans will watch fireworks, at 85%, compared with 64% among both 18- to 24-year-olds and 25- to 34-year-olds. The same older group is also highest for attending a barbecue or cookout, at 77%, and hosting family or friends, at 66%.
Parades and community events also rise with age, from 36% among 18- to 24-year-olds to 54% among those 65 and older. Travel is much more even, ranging from 28% among 18- to 24-year-olds to 33% among both 35- to 44-year-olds and 45- to 64-year-olds. Visiting a park, beach, lake, or pool is also fairly consistent, with responses ranging from 41% to 46%.
Income
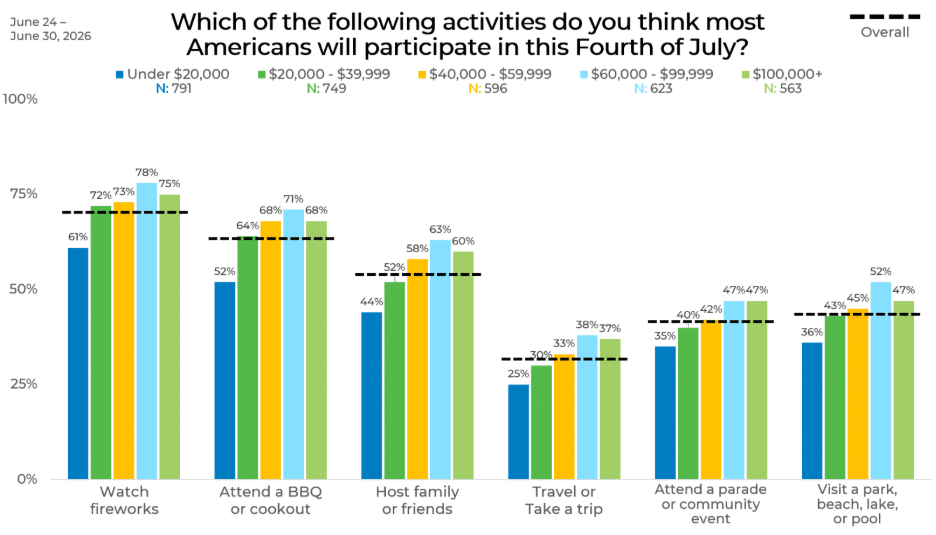
Expectations for several Fourth of July activities generally increase with income. Watching fireworks is lowest among those earning under $20,000, at 61%, and highest among those earning $60,000 to $99,999, at 78%. Barbecues or cookouts follow a similar pattern, rising from 52% among those under $20,000 to 71% among those earning $60,000 to $99,999, before settling at 68% among those earning $100,000 or more.
The income gap is especially visible for hosting family or friends, selected by 44% of those under $20,000 and 63% of those earning $60,000 to $99,999. Travel also rises from 25% in the lowest income group to 38% among those earning $60,000 to $99,999. Visiting a park, beach, lake, or pool ranges from 36% among those under $20,000 to 52% among those earning $60,000 to $99,999.
Political Affiliation
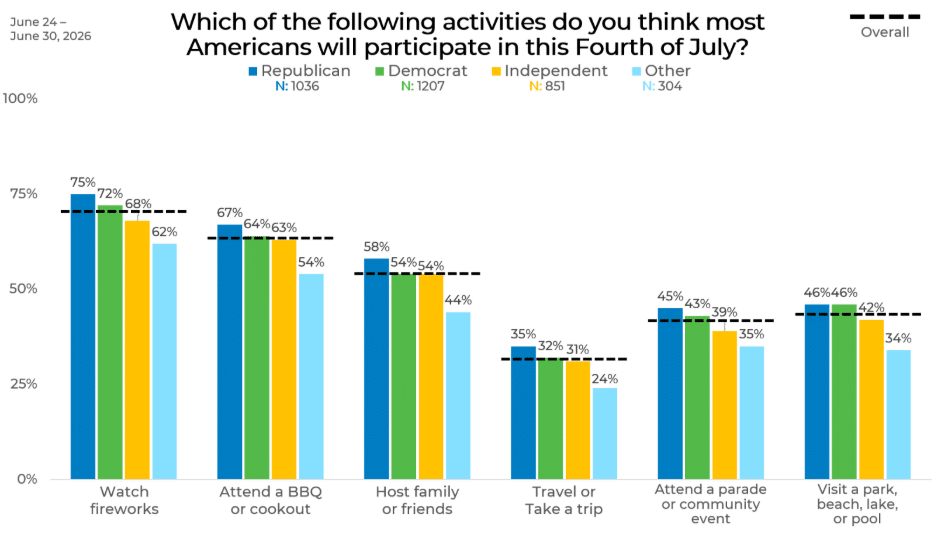
Across political groups, watching fireworks is the leading activity for Republicans, Democrats, Independents, and those identifying with another political affiliation. Republicans are highest on this measure at 75%, followed by Democrats at 72%, Independents at 68%, and Other at 62%. The largest differences appear between Republicans and the Other group across several activities, including hosting family or friends, where Republicans are at 58% and Other is at 44%.
Republicans are also most likely to select attending a barbecue or cookout, at 67%, compared with 64% of Democrats, 63% of Independents, and 54% of Other respondents. Travel ranges from 35% among Republicans to 24% among Other respondents. Visiting a park, beach, lake, or pool is tied among Republicans and Democrats at 46%, followed by Independents at 42% and Other respondents at 34%.
Ethnicity
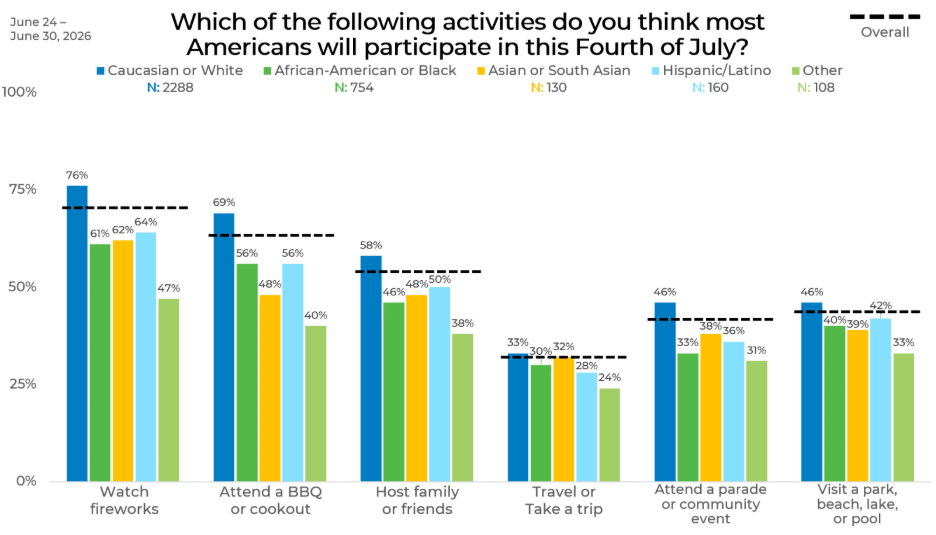
Caucasian or White respondents are the most likely to select each listed activity in this section. The largest gap appears for watching fireworks, with 76% of Caucasian or White respondents selecting it, compared with 61% of African-American or Black respondents, 62% of Asian or South Asian respondents, 64% of Hispanic/Latino respondents, and 47% of respondents in the Other group.
Barbecues or cookouts show another wide spread, from 69% among Caucasian or White respondents to 40% among those in the Other group. Hosting family or friends is highest among Caucasian or White respondents at 58%, while the other groups range from 38% to 50%. Travel is comparatively closer, ranging from 24% among the Other group to 33% among Caucasian or White respondents.
Region
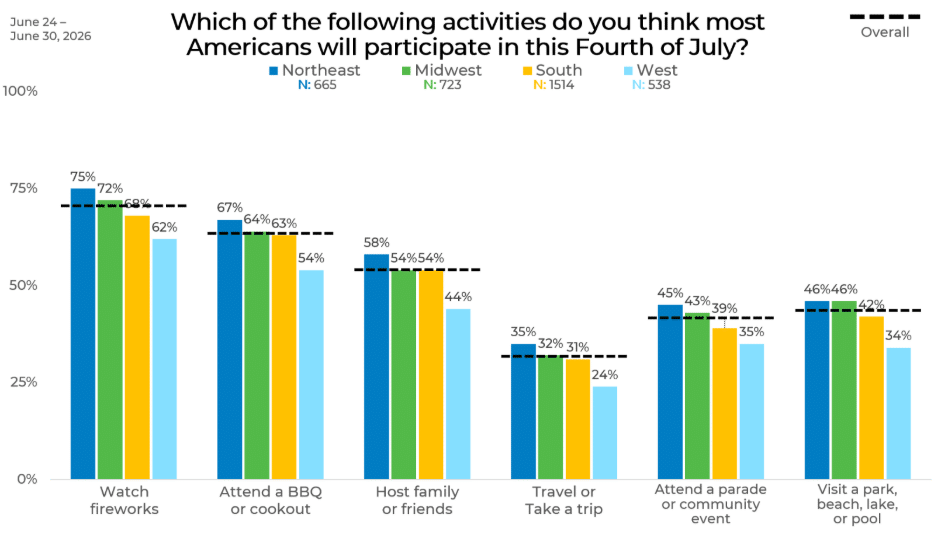
Regional responses are relatively close on several activities, especially hosting family or friends, which ranges only from 54% in the Northeast, Midwest, and South to 55% in the West. Watching fireworks is also consistently high across regions, with the Midwest at 73%, the Northeast at 72%, the West at 70%, and the South at 69%.
The largest regional gap appears for attending a parade or community event. The Midwest is highest at 47%, followed by the Northeast at 45%, the West at 41%, and the South at 38%. Barbecues or cookouts are most common in the Northeast at 67%, while the other regions are closely grouped between 62% and 63%. Travel remains steady, ranging from 31% in the Midwest and West to 33% in the South.
Panel
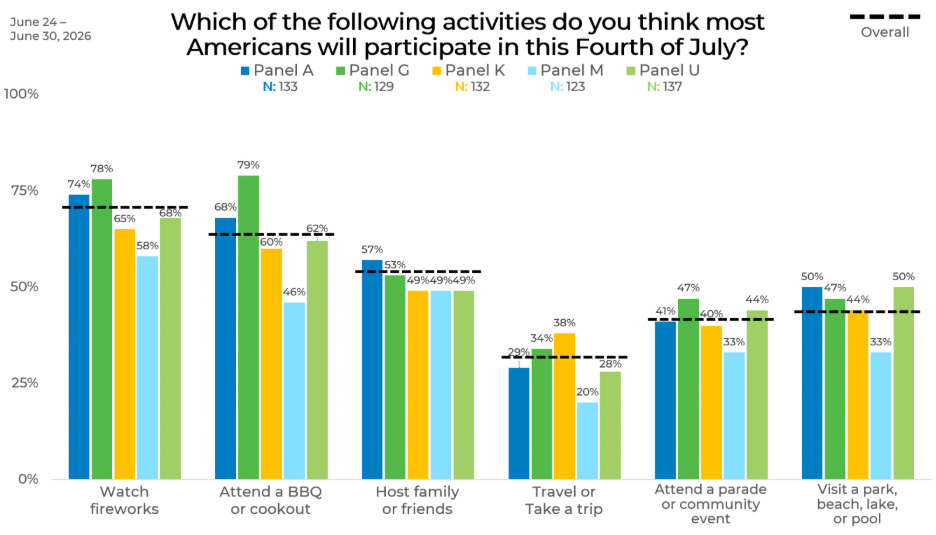
Panel results highlight some of the widest differences in the data, especially for barbecues or cookouts and watching fireworks. Panel G is highest for barbecues at 79%, while Panel M is lowest at 46%, a 33-point gap. Fireworks show a similar spread, from 78% in Panel G to 58% in Panel M.
Panel M is consistently lower across several activities, including travel at 20%, parades or community events at 33%, and visiting a park, beach, lake, or pool at 33%. In contrast, Panel G leads on multiple measures, including fireworks, barbecues, travel, and parades. Visiting a park, beach, lake, or pool is highest in Panels A and U at 50%, while hosting family or friends varies less overall, ranging from 49% to 57%.
Connect with EMI to explore these findings in more depth and discuss what they mean for your research strategy.


