
Making Big Bets, or Asking What’s a Kalshi?
September 22, 2026
No More Redshirt Math: What Consumers Think About the NCAA’s New Eligibility Rules
October 6, 2026
Social media has never exactly been known for standing still, but lately the battle for our attention seems to be moving at warp speed. Platforms are borrowing features from one another, algorithms controlling what we see are constantly changing, all our feeds are filled with AI slop, and video continues to consume more of our scrolling time. Meanwhile, established platforms are fighting to stay relevant as newer ones try to steal a few more minutes of our day. With all that change, we wanted to know whether people’s social habits were changing. So, in our recent wave of research-on-research, we asked people how their current usage of various social media platforms is compared to six months ago.
Let’s dive into the results!
Overall
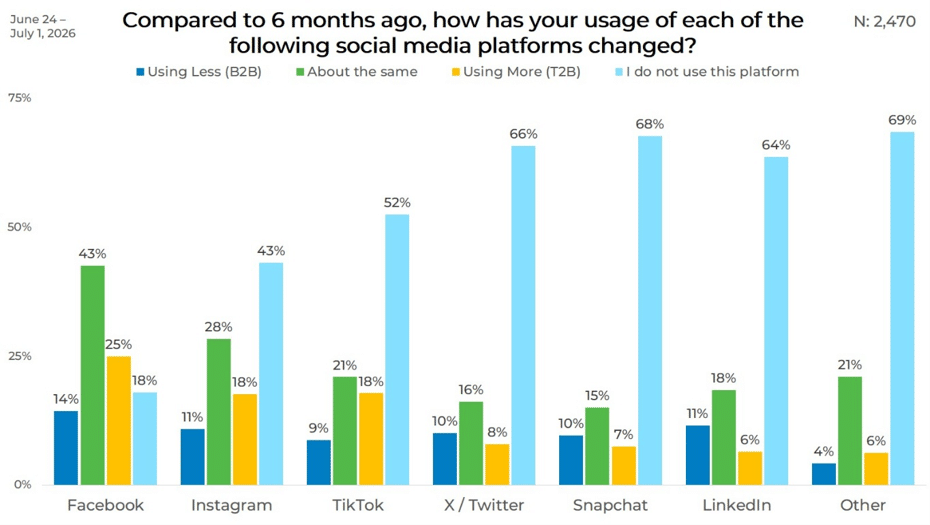
Surprisingly, Facebook had the largest share of respondents who stated they are using the social media platform at the same level they were six months ago. The only other platform that had more than 25% of respondents say their usage remained the same was Instagram.
Across nearly all platforms, roughly 10% of respondents stated they are using social media less than they were six months ago. Only Facebook, Instagram, and TikTok had more than 15% of respondents say they had increased their usage compared to six months ago.
What may have been the biggest insight was the percentage of respondents that stated they are not using a specific platform. Other than Facebook, all the other platforms had 44% or more respondents indicated they do not use the platform.
For the remaining sections, we will be focusing on the usage of specific platforms, not respondents who indicated they did not use them.
Gender
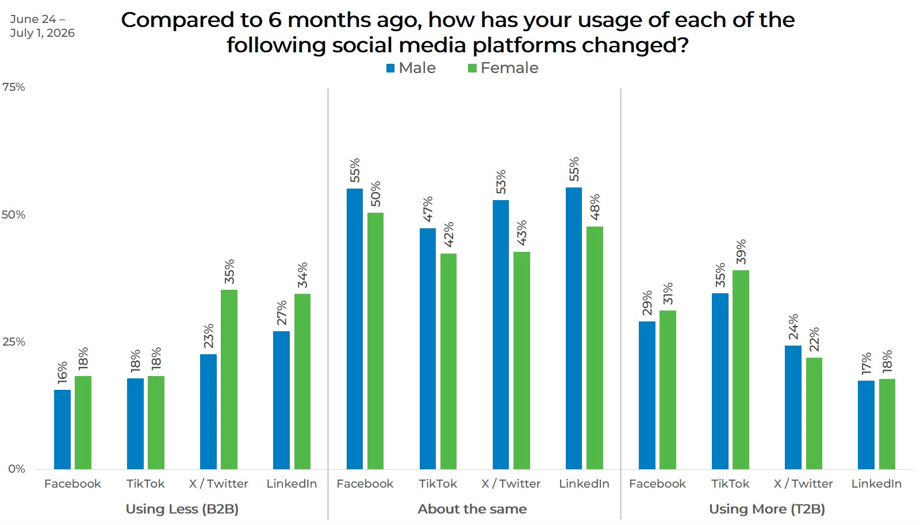
Segmenting the usage data by gender highlights a few interesting usage insights. More females reported increased usage of TikTok and, where slightly more males had increased usage of Twitter/X.
A larger percentage of females reported lower usage of LinkedIn and Twitter/X, between 7 to 12 points higher.
Across all social media platforms, a higher percentage of males than females reported their usage was the same as it was six months previously.
Age
Age seems to be a factor in social media usage changes. TikTok stood out among younger users: 61% of users ages 18–24 said they are using it more than six months ago, falling to 46% among ages 25–34. Instagram followed a similar progression, with increased usage declining from 49% among ages 18–24 to 20% among those 65 and older.
Among those who reported their social media usage remained the same as six months ago, the older the respondent, the more likely it was that their usage of social media remained the same.
While 18–24-year-olds increased their usage of TikTok and Instagram, it came at the expense of Facebook and Snapchat. Both platforms saw young users reduce their usage, with 33% of 18–24-year-olds reducing their Facebook usage, and 46% reducing their Snapchat usage.
Income
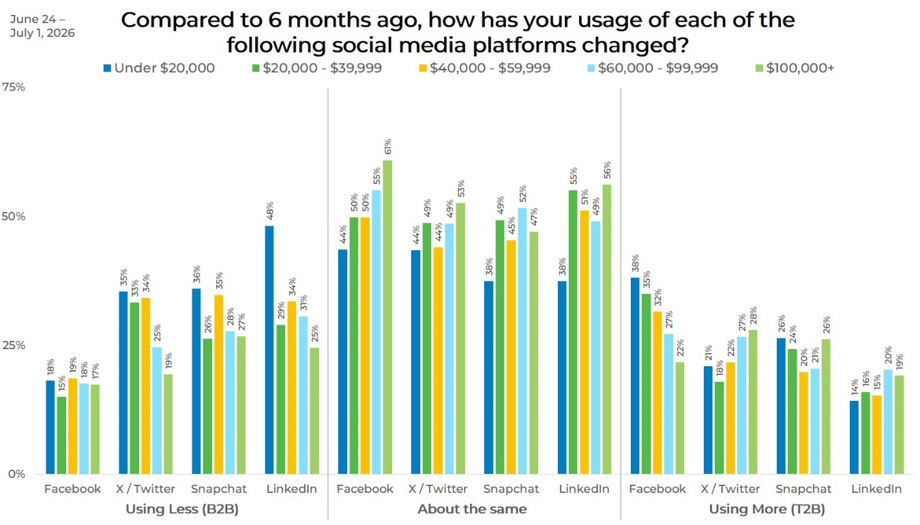
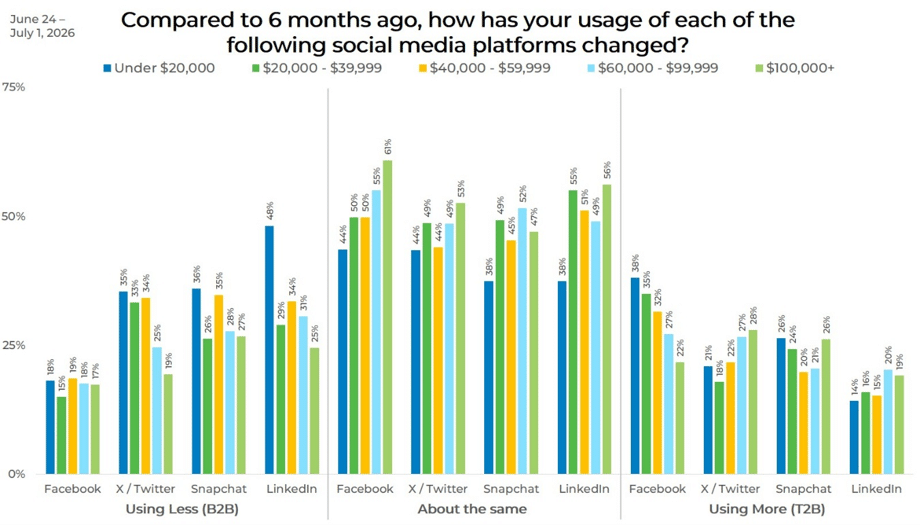
There were some interesting trends when the data was segmented by income. The number of respondents who increase their usage of Facebook decreases as income level increases. Inversely, the number of respondents who increased their Twitter/X usage increased as income increased.
When we look at respondent who reduced their social media usage compared to six months ago, we see those at the $20,000 or less income level had the higher number across all social media platforms but Facebook.
Respondents with an income of over $100,000 were more likely to have maintained their current usage of all platforms but Snapchat compared to six months ago.
Political Affiliation
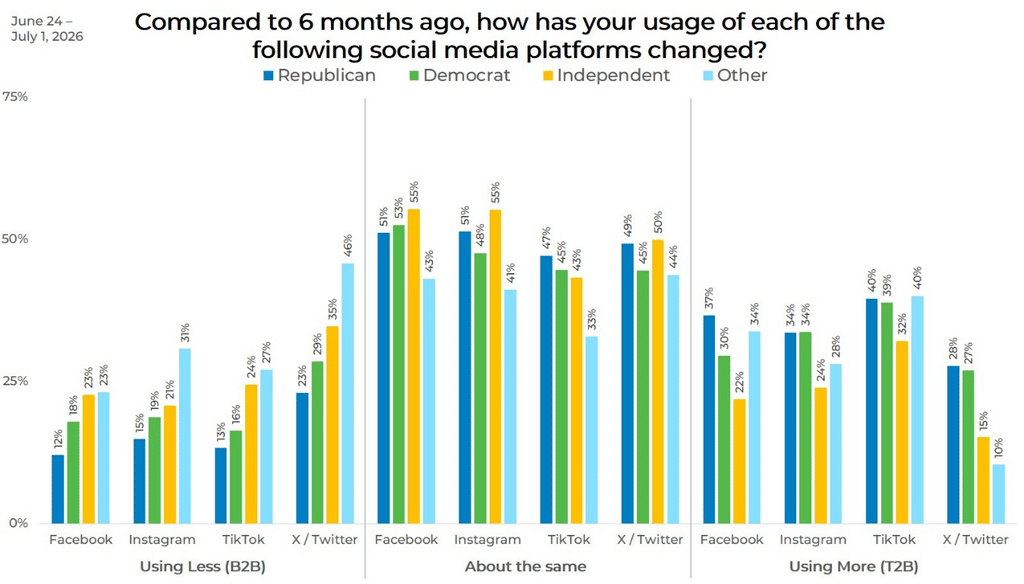
A majority of Republicans maintained their social media usage compared to six months ago. Only 15% or less reduced their usage of platforms like Facebook, Instagram or TikTok. Democrats had a similar number of respondents say they reduced their social media usage as Republicans, but just a couple percentage points higher.
Compared to Democrats and Independents, Republicans had the highest percentage of respondents indicate they had increased their usage of each social media platform.
Ethnicity
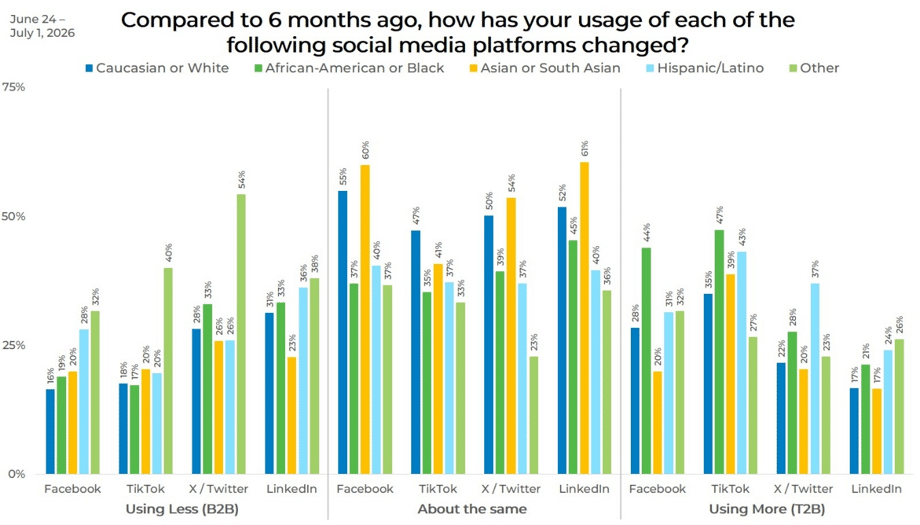
Changes in social media usage varied when looking at the data by ethnicity. Hispanics had the highest percentage of respondent report that their Facebook usage had declined compared to six months ago (28%), eight-to-twelve points higher than other groups. More African Americans than other ethnicities reported reducing their usage of Twitter/X, five-to-seven points higher.
Nearly all ethnicities had a third of respondents say they reduced their LinkedIn usage, except Asian, who were 10-15 points lower.
Among respondents who maintained their social media usage, Asians had between 50-65% say they maintain usage of Facebook, LinkedIn and Twitter, the highest rate across all groups. Caucasians had the second highest rate of respondents stating their social media usage had not changed when compared to other groups.
African Americans reported the highest percentage of respondents that indicated their social media declined for Facebook and TikTok, 44% and 47% respectively. Hispanics had the largest percentage of respondents say they reduced their usage, 9-17 points higher than other groups.
Panel
We included respondents who indicated they do not use the platform when we looked at the data by panel. It helped highlight the differences we observed. There were similar number of respondents from each panel that indicated they had reduced their usage of Facebook, TikTok and Twitter/X. Instagram had the largest difference between panels around declining usage, with an 8-point difference between Panels E and I.
There was more variation when looking at respondents who indicated they had increased their usage of different social media platforms over the last six months. Across all platforms, Panels N and S had the highest number of respondents stating they had increased their usage.
When we look at the results of respondents that indicated they don’t use the panel, that’s where we see some of the biggest differences between panels. With Facebook, Panel I has 30% of respondents stating they don’t use the platform, which is 8 to 16 points higher than other panels.
Instagram has similar fluctuations between panels as Facebook. There is a 17-point difference between Panels I and S in terms of the number of respondents who indicated they do not use the platform. The gap between panels is even higher when looking at TikTok. 70% of Panel A’s respondents say they do not use the platform, 32-points higher than Panel S, and 11-points higher than Panel I, the second highest panel.
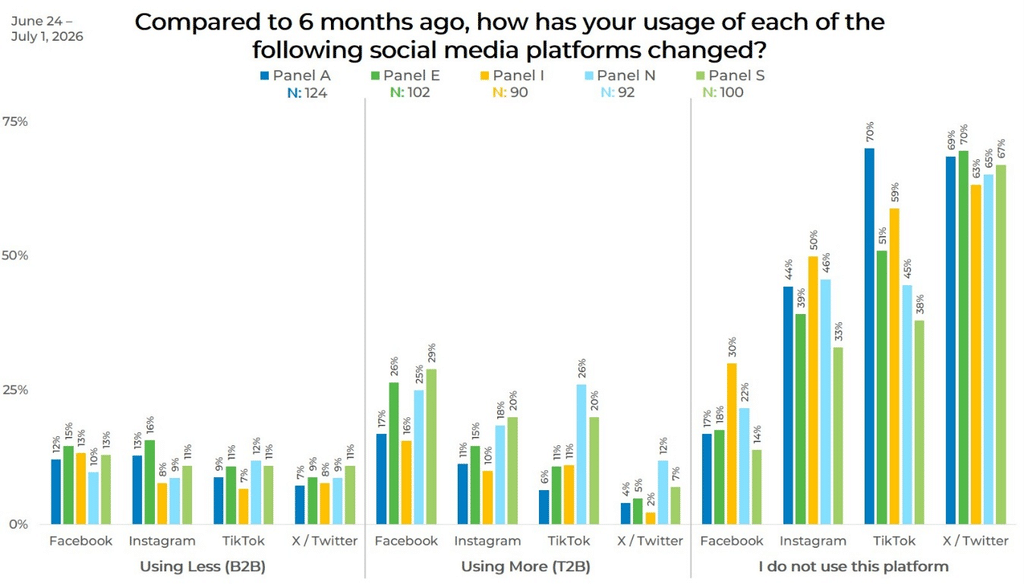
This data really highlights the differences in results you can get based on the panel selection you use. There is a way to mitigate this though; and it’s through Strategic Sample Blending. Click the button below to learn more.