
The Right Tool for the Right Job: Preferred AI Tools Across Common Tasks
June 22, 2026
Beyond the Gift Card: What Really Motivates Survey Participants
June 26, 2026
The economy impacts everyone, and its performance usually dictates people’s spending habits. In our recent wave of research-on-research, we sought to understand how US consumers feel about the state of the economy. What we uncovered was interesting.
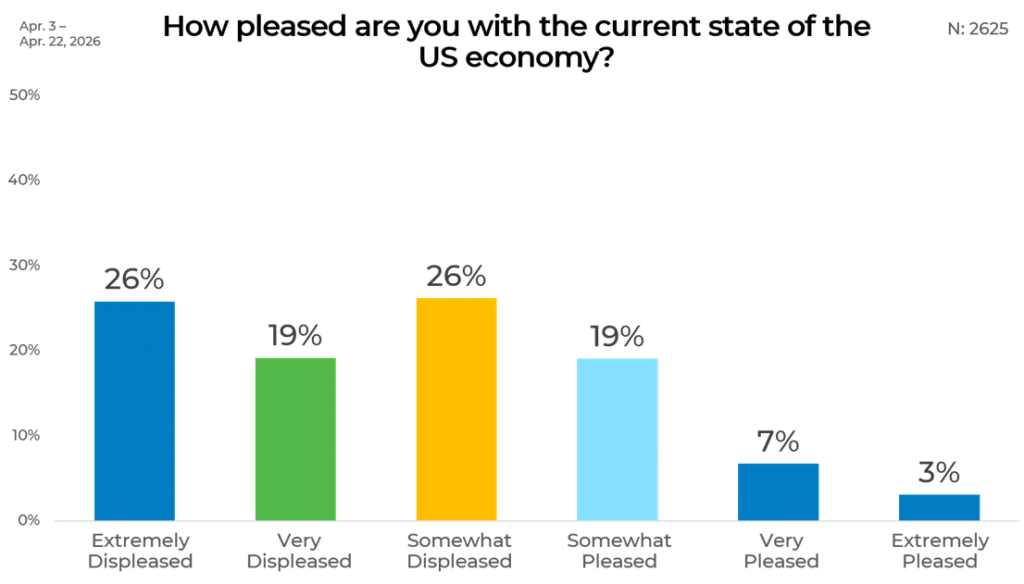
Views of the current U.S. economy skew heavily negative overall. For this analysis, responses were grouped into two categories: “pleased,” which includes the top three response options, and “displeased,” which includes the bottom three. The results show that dissatisfaction extends across multiple levels, from mild frustration to strong disapproval, rather than being concentrated in a single group.
Overall
Overall, 71% of respondents are displeased with the current state of the U.S. economy, compared with 29% who are pleased. Negative sentiment is spread across multiple levels of dissatisfaction, with the largest shares describing themselves as either “extremely displeased” or “somewhat displeased” (26% each). Another 19% say they are “very displeased.” On the positive side, most respondents fall into the “somewhat pleased” category (19%), while just 7% are “very pleased” and 3% are “extremely pleased.”
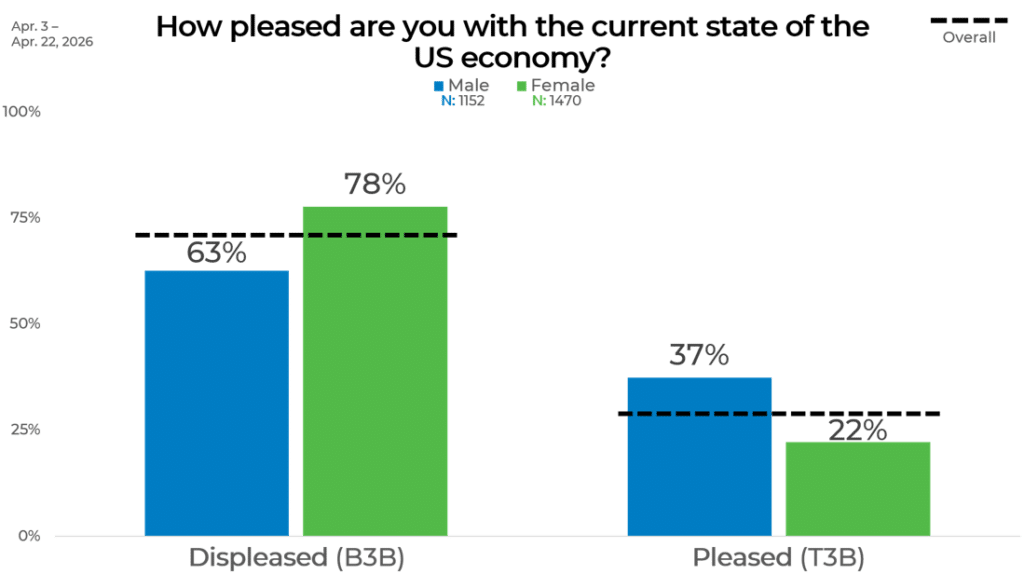
Gender
Women express more dissatisfaction with the economy than men. Among female respondents, 78% are displeased with the current state of the economy, compared with 63% of male respondents. Conversely, 37% of men report being pleased, while only 22% of women say the same.
Although both groups are more likely to be dissatisfied than satisfied, the divide is notably larger among women. Men are 15 percentage points less likely than women to report being displeased and 15 points more likely to report being pleased.
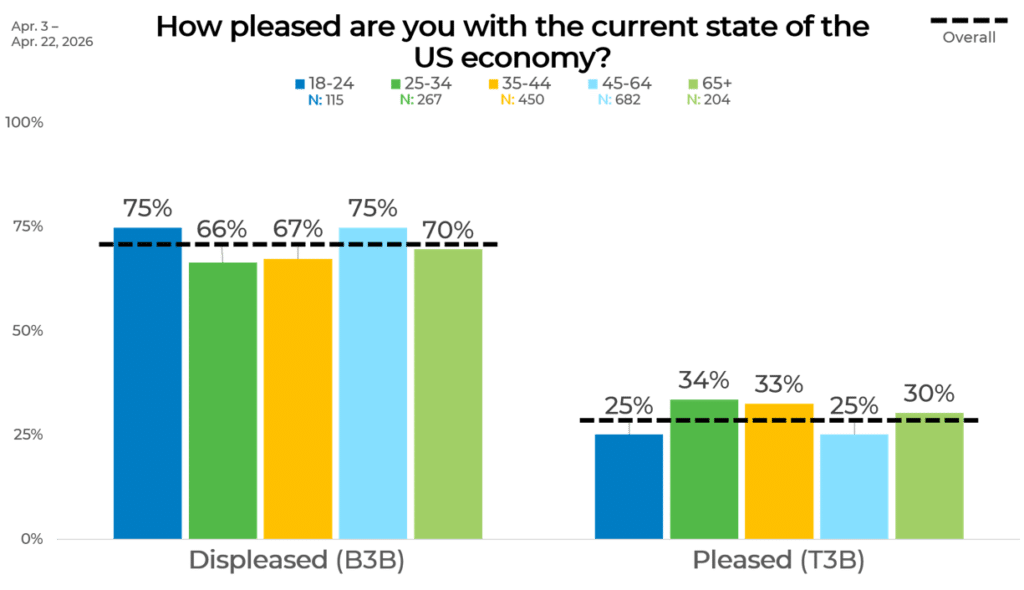
Age
Negative views of the economy are the majority position across every age group. Respondents ages 18–24 and 45–64 express the highest levels of dissatisfaction, with 75% in each group reporting they are displeased and 25% saying they are pleased.
Adults ages 25–34 and 35–44 are somewhat more positive, though displeasure still outweighs satisfaction. Among respondents ages 25–34, 66% are displeased and 34% are pleased, while those ages 35–44 are split 67% displeased and 33% pleased.
Respondents ages 65 and older fall close to the overall average, with 70% reporting they are displeased and 30% saying they are pleased. Overall, the results suggest that concerns about the economy are widespread across generations, even if younger and middle-aged adults differ slightly in the intensity of those views.
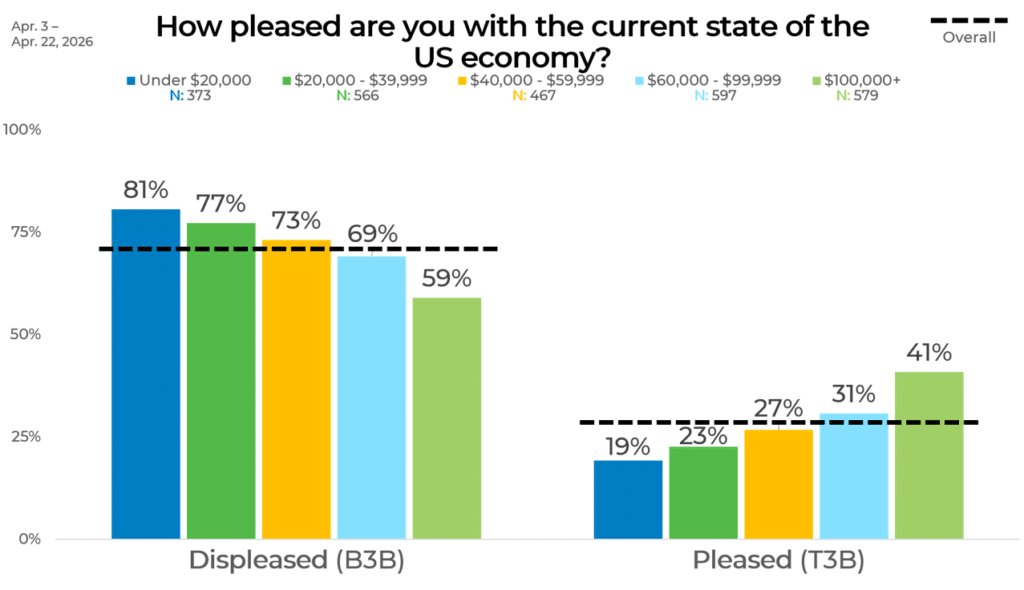
Income
Income is closely tied to views of the economy. As income rises, respondents become less likely to report dissatisfaction and more likely to express positive views.
Among those earning under $20,000 annually, 81% are displeased with the economy and 19% are pleased. Displeasure gradually declines across each income bracket, falling to 77% among respondents earning $20,000 to $39,999, 73% among those earning $40,000 to $59,999, and 69% among those earning $60,000 to $99,999.
Respondents earning $100,000 or more report the most favorable views, though a majority still express dissatisfaction. In this group, 59% are displeased and 41% are pleased, the highest pleased share of any income category. Overall, the results point to a clear relationship between higher income and more positive assessments of the economy.
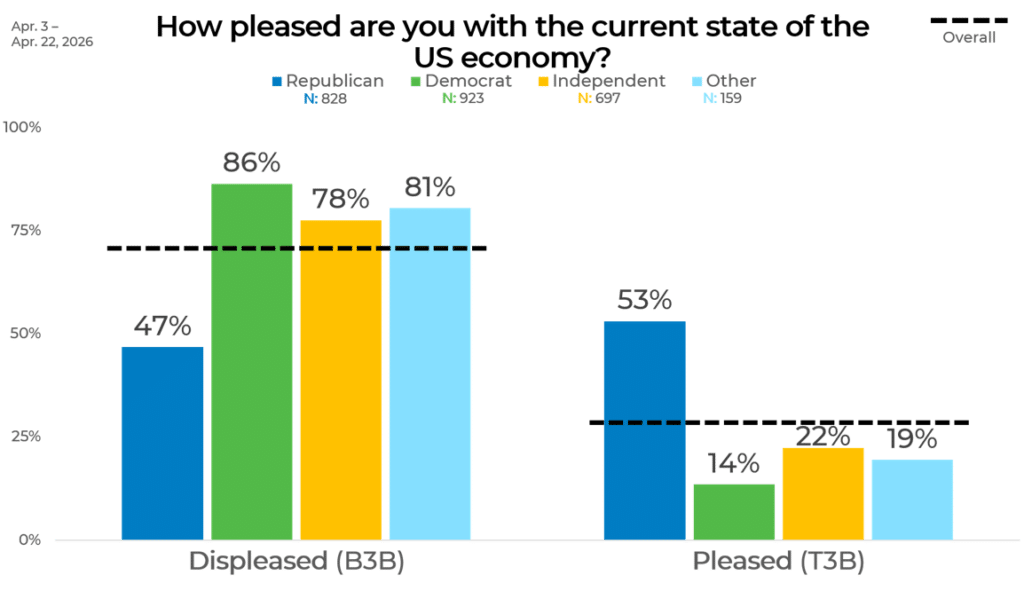
Political Affiliation
Political affiliation reveals the strongest divide in views of the economy. Republicans are the only group in which a majority report being pleased, with 53% pleased and 47% displeased.
In contrast, Democrats report the highest level of dissatisfaction, with 86% displeased and just 14% pleased. Respondents identifying with another political affiliation are similarly negative, with 81% displeased and 19% pleased, while independents are close behind at 78% displeased and 22% pleased.
The contrast between Republicans and Democrats is particularly stark. Democrats are 39 percentage points more likely than Republicans to report being displeased with the economy, while Republicans are 39 points more likely to report being pleased.
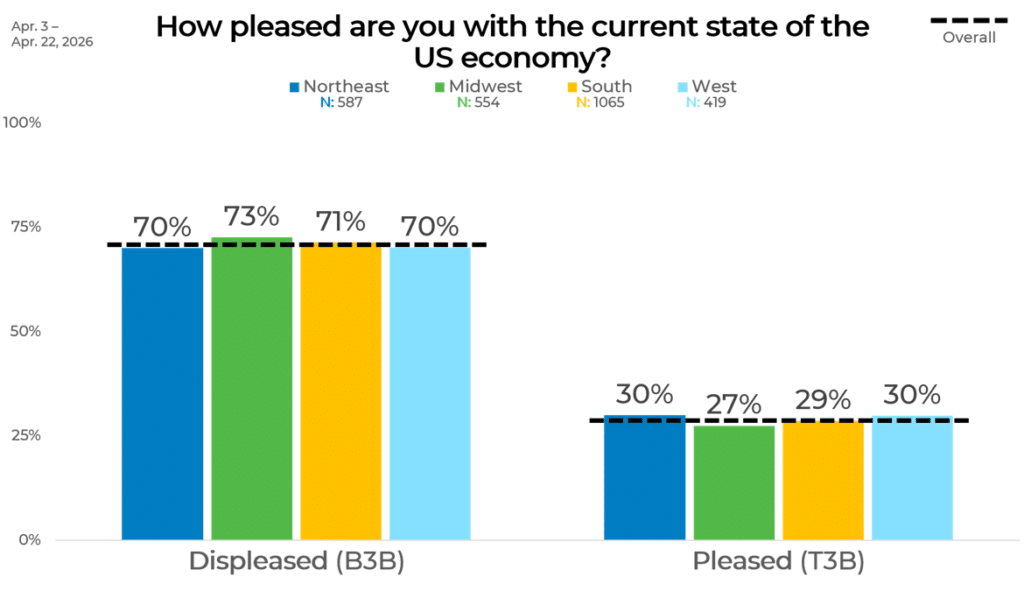
Region
Views of the economy are remarkably consistent across regions. Displeasure levels vary only slightly across the Northeast, Midwest, South, and West, ranging from 70% to 73%.
The Midwest reports the highest level of dissatisfaction at 73%, followed by the South at 71%. The Northeast and West are tied at 70% displeased. Positive views show a similarly narrow range, with 30% of respondents in both the Northeast and West reporting they are pleased, compared with 29% in the South and 27% in the Midwest.
Overall, the results suggest that concerns about the economy are broadly shared across the country, with only modest regional differences.
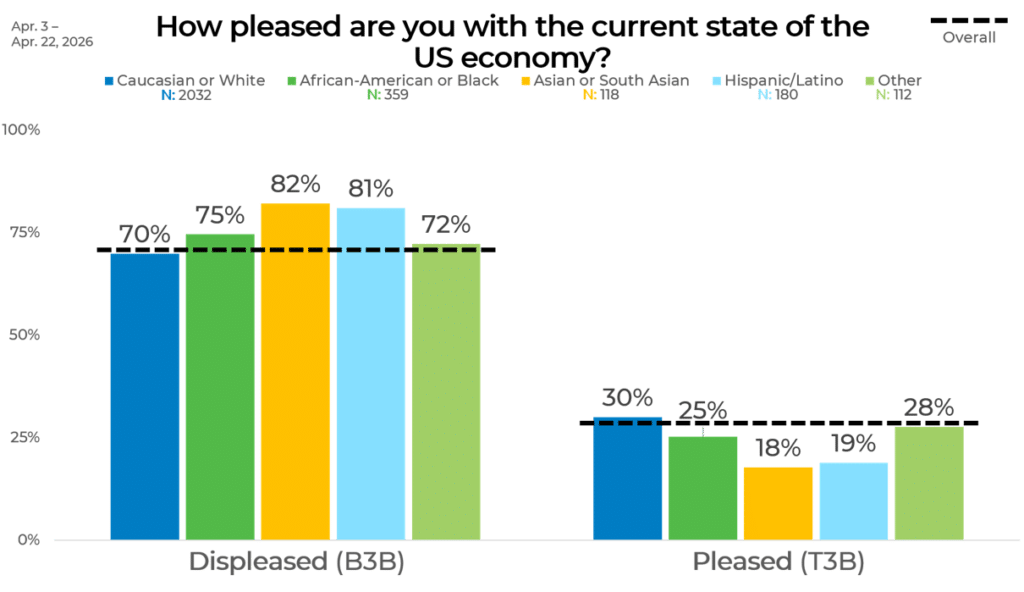
Ethnicity
Displeasure with the economy is the majority view across every racial and ethnic group included in the data. Asian or South Asian respondents report the highest level of dissatisfaction, with 82% displeased and 18% pleased. Hispanic/Latino respondents follow closely, with 81% displeased and 19% pleased.
Among African-American or Black respondents, 75% are displeased and 25% are pleased. Respondents in the Other category are somewhat less negative, with 72% displeased and 28% pleased. Caucasian or White respondents report the lowest level of displeasure among the groups measured, at 70%, and the highest share of pleased responses, at 30%. Overall, while levels of dissatisfaction vary across groups, negative views of the economy remain widespread among all respondents.
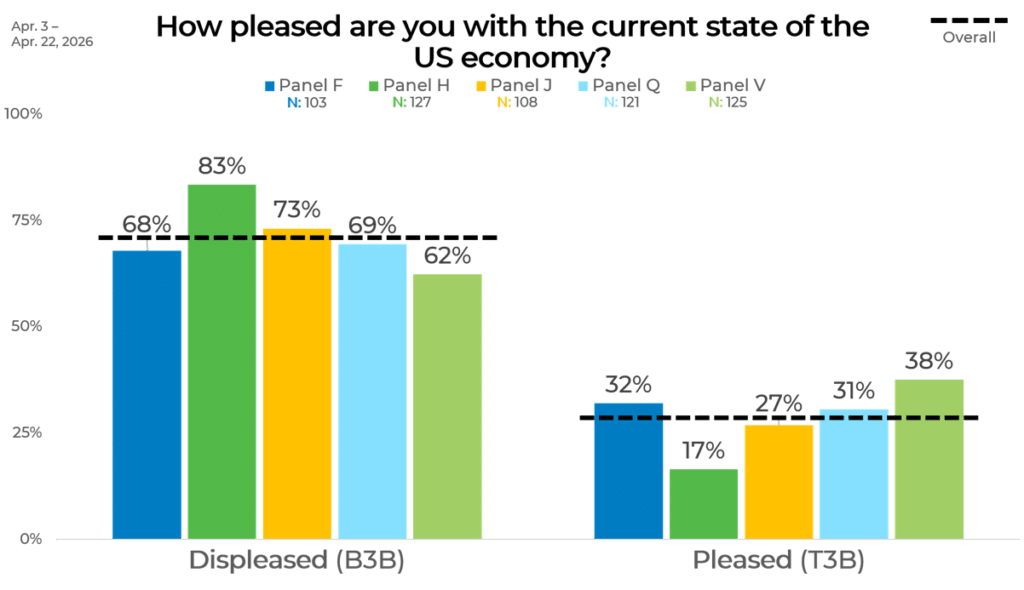
Panel
Panel results show more variation than regional differences, but less than the gaps seen across political affiliation and income groups. Panel H reports the highest level of displeasure, with 83% of respondents expressing negative views and 17% expressing positive views. Panel J follows with 73% displeased and 27% pleased.
The remaining panels show somewhat lower levels of dissatisfaction. Panel Q is 69% displeased and 31% pleased, while Panel F is close behind at 68% displeased and 32% pleased. Panel V reports the most positive results among the five panels, though a majority remain displeased, with 62% negative responses and 38% positive responses. Overall, the panel results suggest that dissatisfaction is consistent across respondent sources, with some differences in the intensity of those views.
Economic confidence is low, but the story is more complex than a single number. While dissatisfaction is widespread, the data reveals meaningful differences in how groups experience and interpret today’s economy, with the largest divides emerging across political affiliation and income.
Connect with EMI to explore these findings in more depth and discuss what they mean for your strategy.


