
Season 8 Is Here!
January 21, 2025Savior or Scourge: The Changing Opinions Around AI
January 31, 2025Generative AI tools are becoming increasingly integrated into everyday life, but who’s actually using them, and how do preferences differ across various groups? Let’s dive into the latest data from our recent wave of research-on-research and see the trends we’ve uncovered in generative AI adoption. From ChatGPT leading the pack to Gemini’s rapid growth, the insights reveal what tools people are using and how adoption varies across key demographics and shifts over time.
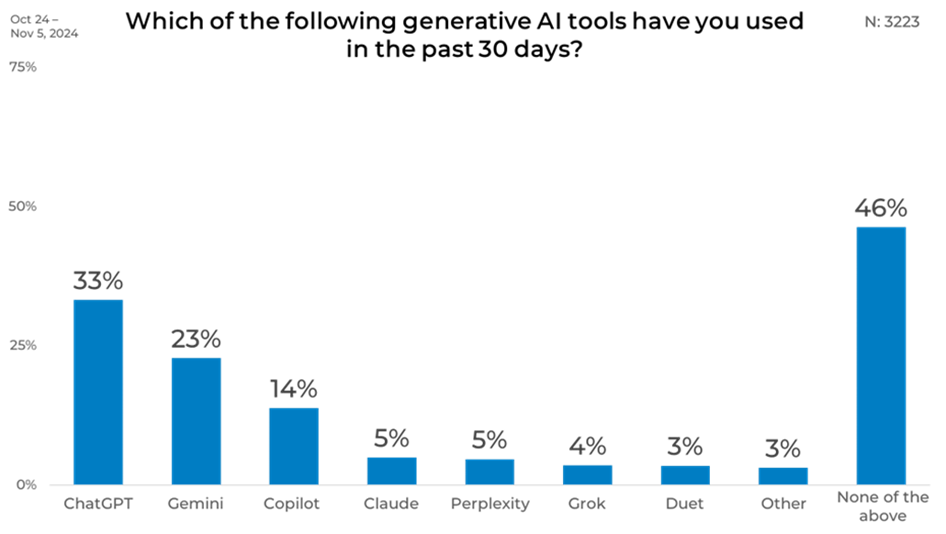
Overall
In the past 30 days, nearly half of respondents (46%) reported not using any generative AI tools. Among those who did use generative AI, ChatGPT led the pack with 33%, followed by Gemini at 23% and Copilot at 14%. Claude had the lowest level of usage, with only 5%. This data highlights a significant gap between those engaging with generative AI tools and those not utilizing them, as well as a clear preference for ChatGPT among users.
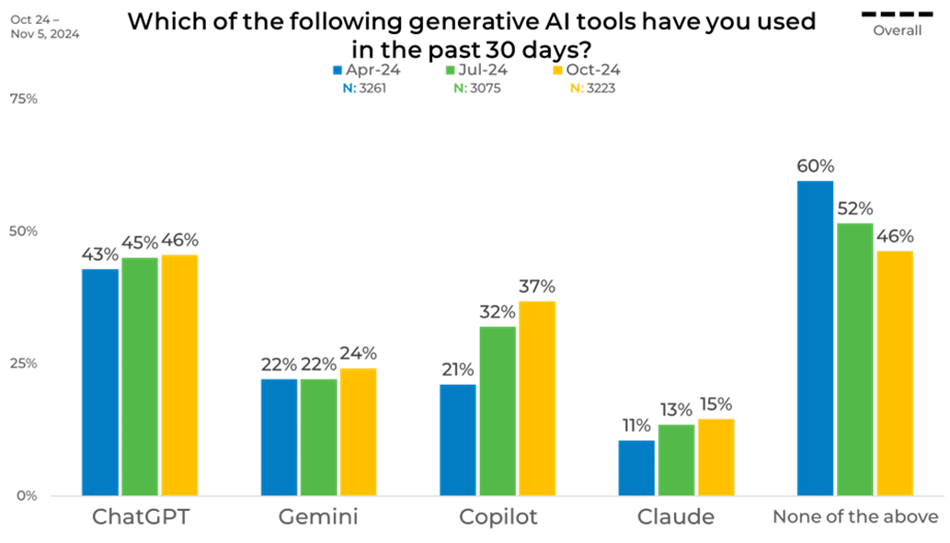
Wave-Over-Wave
Usage of generative AI tools has shown consistent growth throughout 2024. Gemini experienced the most significant growth, surging from 21% to 37%. ChatGPT usage rose from 43% to 46%, while Copilot increased slightly from 22% to 24%. Claude also gained traction, climbing from 11% to 15%.
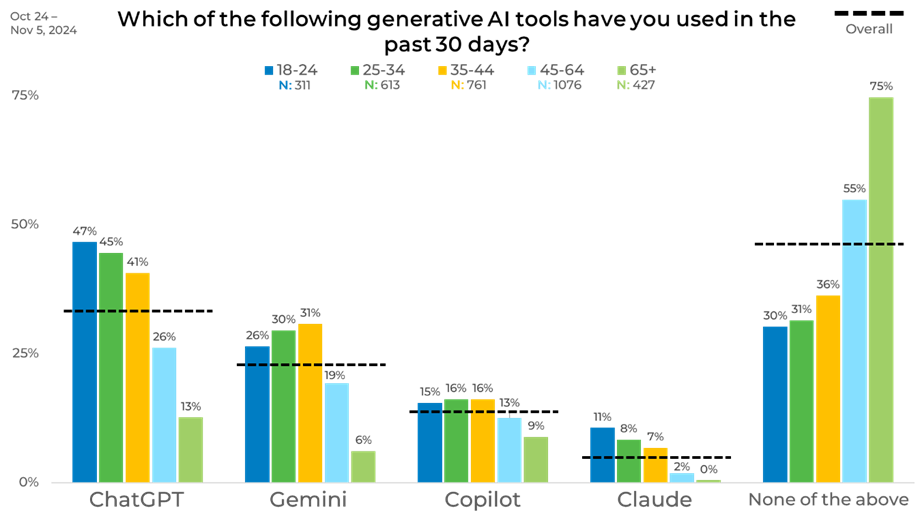
Age
There was a clear trend when looking at the data by age – younger age groups are far more likely to use generative AI tools than older ones. ChatGPT usage is highest among those aged 18-24 (47%) and 25-34 (45%) but drops significantly to 26% for ages 45-64 and just 13% for 65+. A similar pattern is observed for Gemini, with usage peaking among 35-44-year-olds (31%) and plummeting to 6% among those 65+. Claude’s usage is minimal overall but highest in the 18-24 age group (11%), while older adults (65+) reported no usage of Claude.
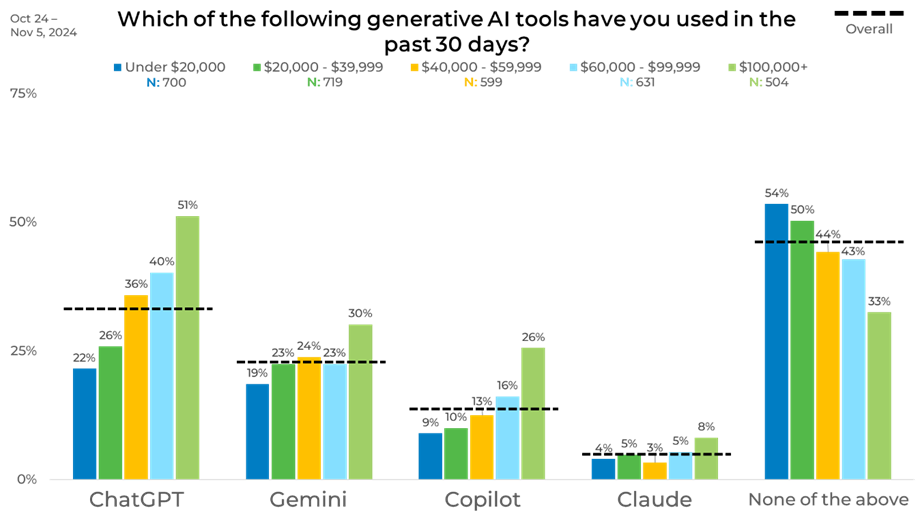
Income
The income breakdown shows a strong correlation between higher income levels and greater use of generative AI tools. ChatGPT usage rises steadily from 22% among those earning under $20,000 to 51% among those earning $100,000 or more. Similarly, Copilot usage jumps from 9% in the lowest income group to 26% in the highest. Gemini shows a more modest increase, peaking at 30% in the $100,000+ bracket. Claude usage remains minimal across all income levels, with a slight uptick at higher incomes (8% for $100,000+).
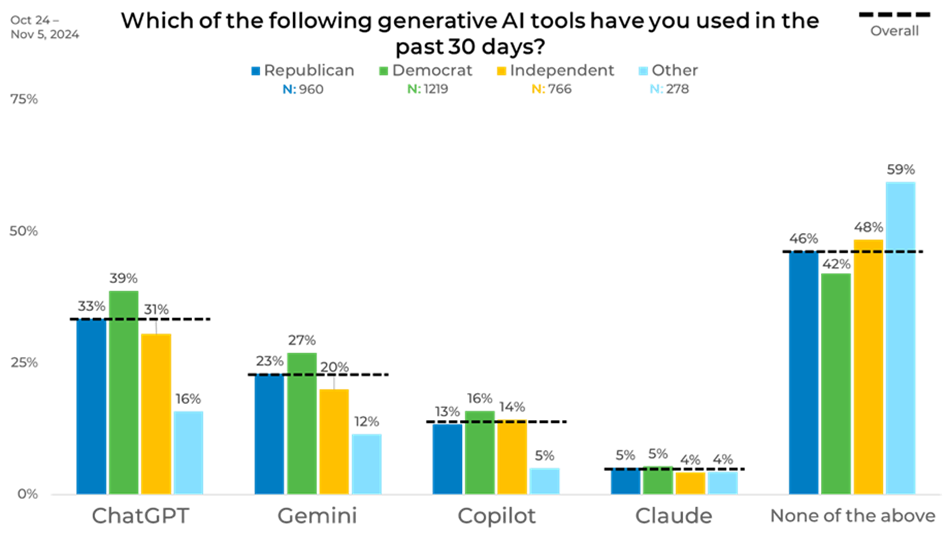
Political Affiliation
The political breakdown highlights some intriguing differences in generative AI tool usage. Democrats reported the highest usage across all tools, with 39% using ChatGPT and 27% using Gemini, compared to Republicans (33% and 23%) and Independents (31% and 20%). Those identifying as “Other” reported the lowest usage rates, with only 16% using ChatGPT and 12% using Gemini.
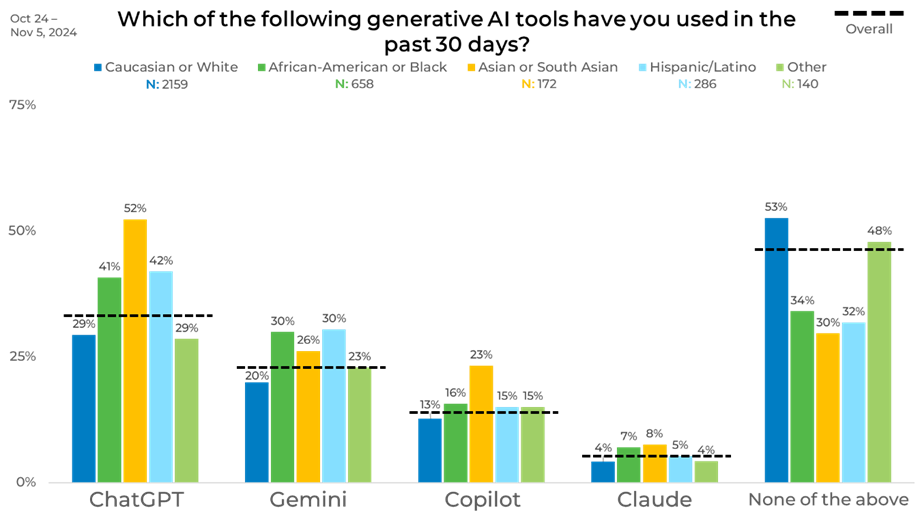
Ethnicity
Usage of generative AI tools varies depending on ethnicity. ChatGPT is most popular among Asian or South Asian respondents (52%), followed by Hispanic/Latino (42%) and African American respondents (41%). Caucasian and “Other” groups report lower usage (29% each). Gemini follows a similar trend, with higher usage among African American (30%) and Hispanic/Latino (30%) respondents compared to Caucasian (20%) and “Other” (23%). Copilot sees its highest adoption among Asian or South Asian respondents (23%), while Claude has minimal usage across all groups, peaking at 8% among Asian or South Asian respondents. “None of the above” responses are highest among Caucasian (53%) and “Other” (48%) respondents, while African American (34%) and Asian or South Asian (30%) respondents are the least likely to avoid generative AI tools.
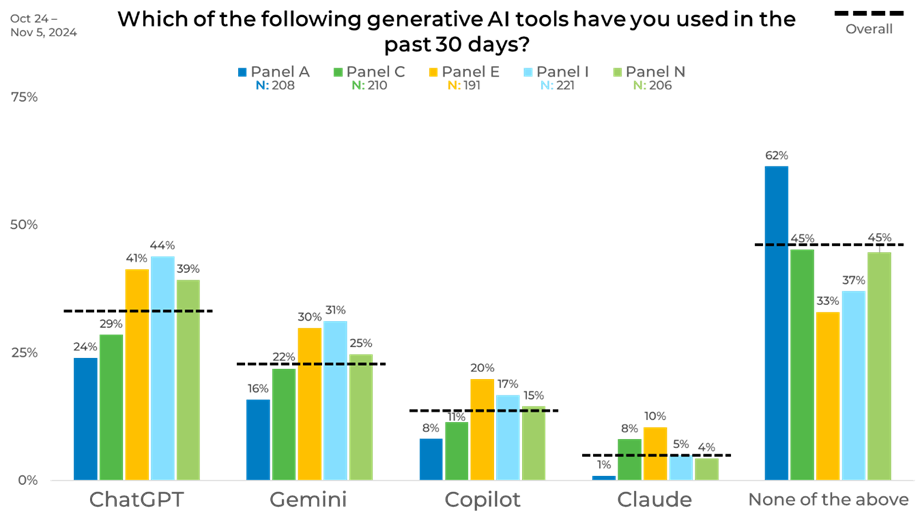
Panel
There are significant usage differences of generative AI tools by panel. Panel I shows the highest adoption of ChatGPT at 44%, followed closely by Panel E (41%) and Panel N (39%), while Panels A and C trail at 24% and 29%, respectively. Similarly, Gemini sees its most significant usage in Panels I (31%) and E (30%), with Panel A reporting the lowest usage at 16%. Copilot usage peaks in Panel E (20%) but remains notably lower in Panel A (8%) and Panel C (11%). Claude is least used overall but reaches 10% in Panel E, compared to just 1% in Panel A. Interestingly, “None of the above” responses are highest in Panel A (62%) but drop significantly in Panel E (33%) and Panel I (37%), indicating these two panels are the most engaged with generative AI tools.
Looking to mitigate panel bias on your next study better? Find out how EMI can help – request a free consultation.


