Election Season Around the Corner: Where Do Americans Stand on Ballot Issue Importance?
May 6, 2024
For Better or For Worse: How Do Americans Feel About the US Economy?
May 7, 2024In a world that moves faster than most can keep up, convenience is key. Americans are looking to time-saving solutions for different parts of their routines – one of them being meal kit delivery services.
In our recent round of research-on-research, we wanted to explore the usage of this type of service. Knowing there are many different options for diverse dietary requirements and varying preferences on how hands-on the experience is; we decided to focus on two services: Hello Fresh and Blue Apron.
Overall
In the past month, a small fraction of individuals have engaged with meal kit delivery services like Blue Apron or HelloFresh, with only 7% reporting usage.

Age
This data set reveals a rather large discrepancy, comparatively. The age breakdown for the usage of meal kit delivery services like Blue Apron or HelloFresh has a difference of 7% between 18-24 year olds and those aged 65+. Younger adults, specifically those aged 18-24, show the highest usage rate at 10%, closely followed by the 25-34 and 35-44 age brackets, both at 9%. Usage declines among older demographics, with only 5% of those aged 45-64 and a mere 3% of those aged 65 and older engaging with these services.
This reflects that younger age groups find the convenience and novelty more appealing compared to older age groups, who weren’t exposed to these kinds of services at a younger age.

Income
Not surprisingly, with meal kit delivery being a somewhat luxury convenience solution-- the income breakdown for the usage of services such as Blue Apron or HelloFresh shows a clear trend that higher income correlates with increased usage.
Individuals earning over $100,000 lead the statistics with 12% using these services, which suggests meal kits are more commonly utilized among higher earners. Those in the $60,000 - $99,999 range also show notable usage at 8%. Usage decreases progressively in lower income brackets, with 7% of those earning $40,000 - $59,999, 5% of those with incomes between $20,000 and $39,999, and only 4% of those making under $20,000 engaging with these services.
This pattern indicates that affordability and possibly the perceived value of meal kits vary significantly across different income levels, making them more accessible and appealing to wealthier demographics.

Ethnicity
The ethnicity breakdown shows distinct preferences among different groups. Both African Americans and Hispanics/Latinos reported the highest usage rates at 11% each. Asians or South Asians also participated at a notable rate of 8%. Meanwhile, Caucasians reported a slightly lower usage rate of 6%.

Panels
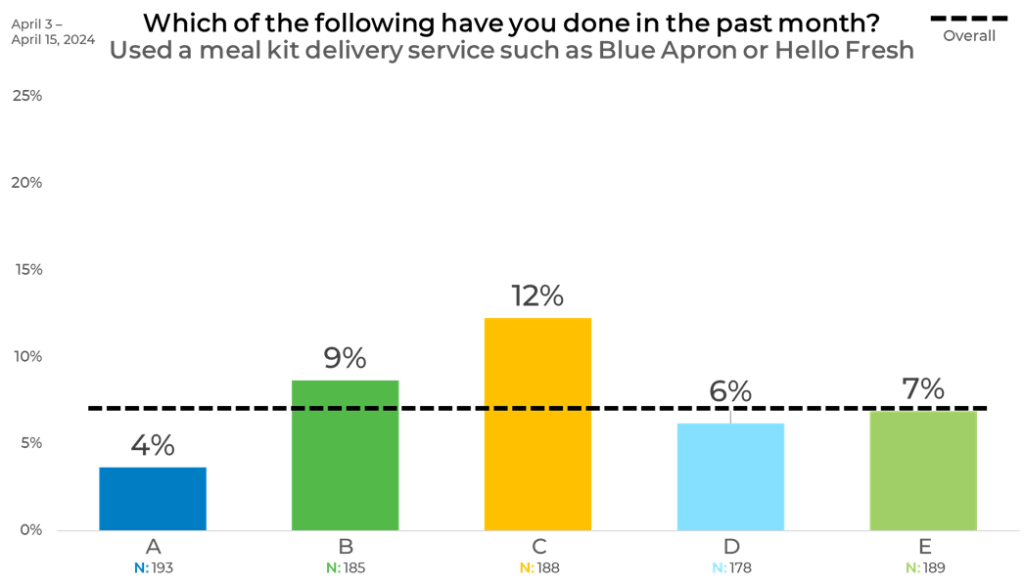
When looking at the data by panel, there are notable variations. Panel C stands out with the highest usage rate at 12%, which is higher than Panel A, who had the lowest recorded rate at only 4%. This 8% difference marks a large disparity amongst paneled groups, highlighting the importance of quality data sampling.

At EMI, we are strategically blending sample to ensure you are accounting for distributed demographic, as well as attitudinal and behavioral balance. You can learn more about how panels differ and how it impacts your data by downloading the latest version of our annual report on the sample industry, The Sample Landscape.


