Gourmet on the Go-Meal Delivery Services: Ditch it or Dig in?
May 7, 2024
Insights into Mental Health Awareness: Deciphering Data on Recognizing Signs
May 14, 2024Everyone knows the rules: no politics, religion, or money talk at the dinner table. It seems that those rules were in place for good reason after comparing the results of our recent round research-on-research— Americans are divided on their opinion of the state of the US Economy.
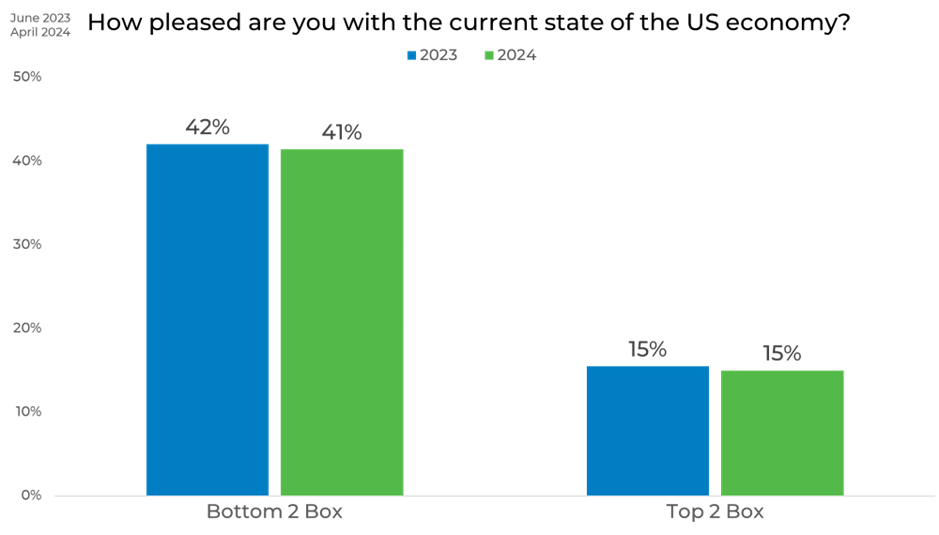
2023-2024 Overall
In assessing the current state of the US economy, the general public’s sentiment has shown a remarkable steadiness from 2023 to 2024.
Data focusing on the extremes of public opinion—captured through the top 2 box and bottom 2 box (out of ten boxes) scores—reveals minor fluctuations over the year.

Gender
Analyzing the gender-specific views on the US economy from 2023 to 2024 reveals slight differences in satisfaction and dissatisfaction. For males, dissatisfaction (Bottom 2 Box) decreased slightly from 38% in 2023 to 37% in 2024, while their satisfaction (Top 2 Box) also saw a small decline from 21% to 19%. In contrast, females showed a decrease in dissatisfaction from 46% to 45%, and an increase in satisfaction from 10% to 12%.
This reveals a subtle shift in economic sentiment across genders, with females becoming marginally more positive about the economy, while males show a decrease in both high satisfaction and dissatisfaction.

Political Affiliation
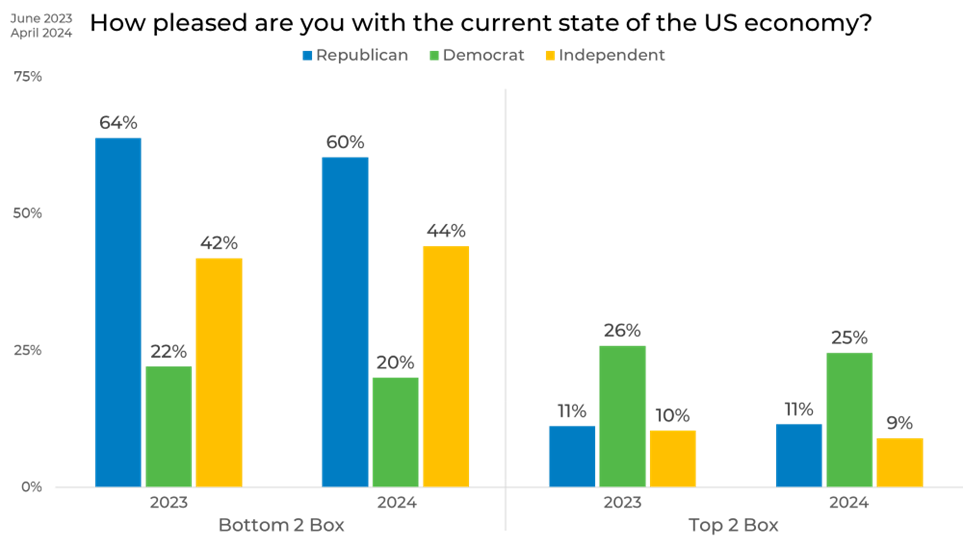
Opinions on the state of the US economy vary significantly depending on political affiliation, highlighting the polarization of views. Republicans are consistently more dissatisfied with 64% and 62% (in 2023 and 2024 respectively) rating their satisfaction as a bottom 2 box, and only 22% and 20% of democrats rating their satisfaction as a bottom 2 box.
Republicans show a notable decrease in economic dissatisfaction—dropping from 64% in 2023 to 60% in 2024, while their satisfaction levels remain constant at 11%. Democrats, on the other hand, experience a slight decrease in both dissatisfaction and satisfaction, with their Bottom 2 Box score moving from 22% to 20% and their Top 2 Box score slightly decreasing from 26% to 25%.

Age
The age-based economic analysis from 2023 to 2024 also reveals rather distinct trends. Among 18-24-year-olds, dissatisfaction rises from 35% to 39%, accompanied by increased satisfaction from 17% to 20%. The 25-34 age group sees dissatisfaction increase from 35% to 37%, with satisfaction dropping from 25% to 21%. In the 35-44 bracket, dissatisfaction climbs from 37% to 40%, while satisfaction decreases from 22% to 16%. Conversely, the 45-64 and 65+ age groups experience reduced dissatisfaction (from 50% to 46% and 46% to 41%, respectively), coupled with increased satisfaction (from 9% to 11% and 7% to 11%).
Overall, younger groups show rising dissatisfaction with slight variations in satisfaction, while older groups seem to demonstrate improved contentment alongside decreased dissatisfaction.

Income
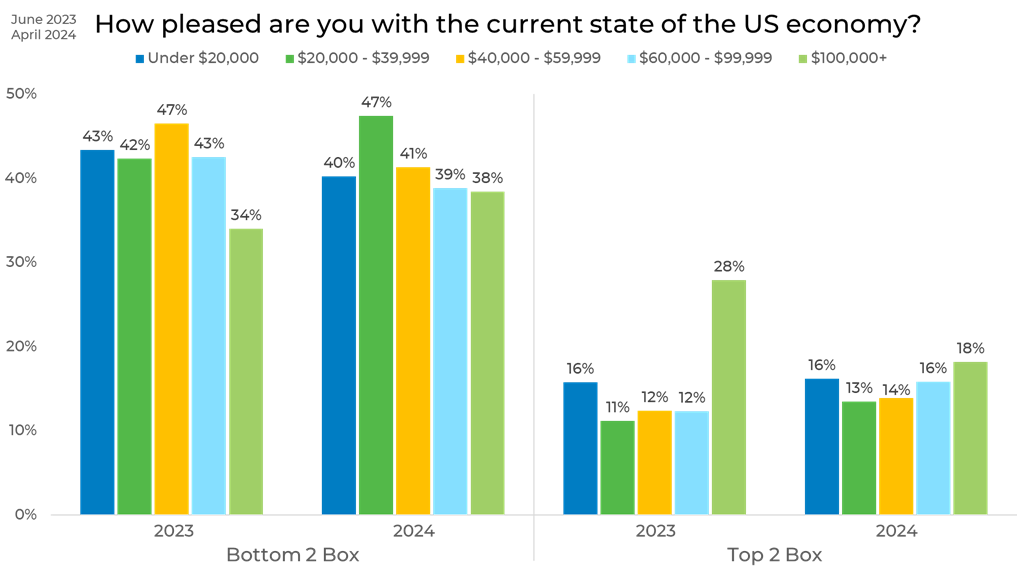
Economic satisfaction across different income levels from 2023 to 2024 shifted from slightly in a negative trend.
For those earning under $20,000 annually, dissatisfaction decreased from 43% to 40%, while satisfaction levels remained constant at 16%.
Individuals with incomes ranging from $20,000 to $39,999 exhibited an increase in dissatisfaction from 42% to 47%, though their satisfaction also slightly increased from 11% to 13%.
The $40,000 to $59,999 income bracket showed a noteworthy decrease in dissatisfaction from 47% to 41%, accompanied by an increase in satisfaction from 12% to 14%.
Those earning between $60,000 and $99,999 also reported a reduction in dissatisfaction from 43% to 39%, with an increase in satisfaction from 12% to 16%.
However, in contrast, the highest earners ($100,000 and above) experienced an increase in dissatisfaction from 34% to 38% and a significant decrease in satisfaction from 28% to 18%.

Panels
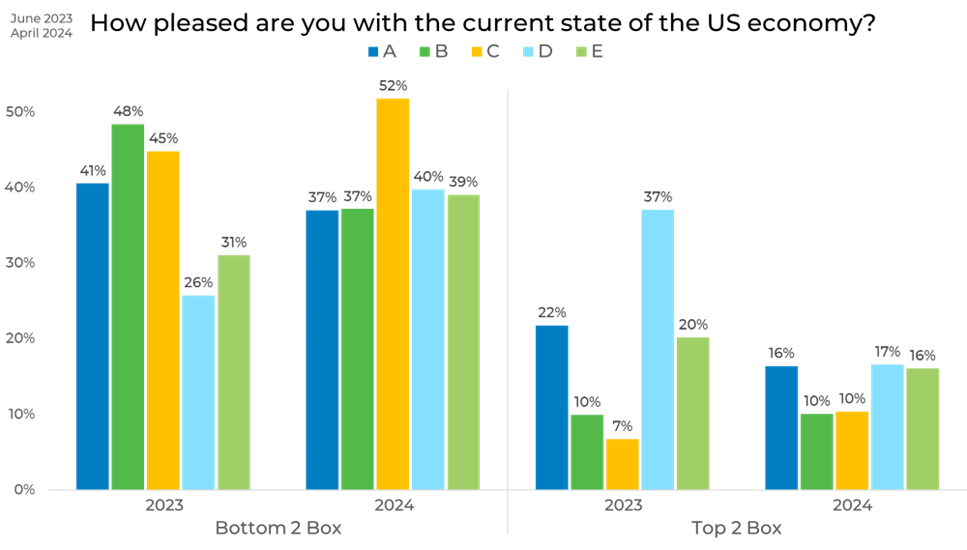
The data from various panels from 2023 to 2024 presents a variety of perception changes regarding the US economy.
Panel A has a decrease in dissatisfaction from 41% to 37%, along with a notable reduction in satisfaction from 22% to 16%. Panel B also sees a drop in dissatisfaction from 48% to 37%, while satisfaction remains steady at 10%. However, Panel C experiences a rise in dissatisfaction from 45% to 52%, yet satisfaction improves from 7% to 10%. In contrast, Panel D undergoes a significant increase in dissatisfaction from 26% to 40%, coupled with a sharp decline in satisfaction from 37% to 17%. Lastly, Panel E reports a rise in dissatisfaction from 31% to 39%, alongside a decrease in satisfaction from 20% to 16%.

In this case, it perfectly represents the obvious disparities in data sampling across panels and why it is so important to have quality data sampling. At EMI, we are dedicated to leading the industry in data confidence and quality. Low-quality data can lead to inaccurate insights, thus creating risky business.
To learn more, you can download our 2024 Edition of the Sample Landscape below!


