
Empathy in Shades: Understanding Diverse Views on the Israel-Hamas Conflict
November 29, 2023
Intellicast S6E29: Some News to Kick-Off December
December 6, 2023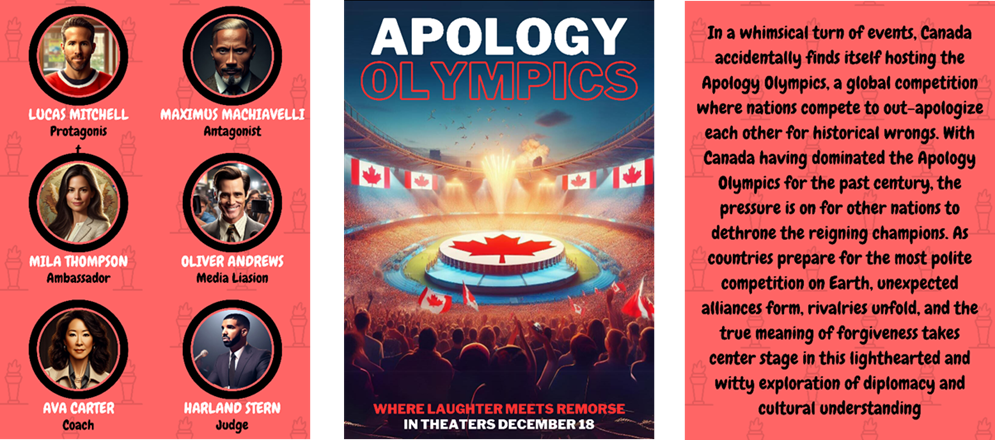
In the realm of cinematic imagination, we conjured up a movie concept titled “Apology Olympics.” From crafting a compelling plot to designing captivating characters and even conjuring eye-catching cover art, every facet of this cinematic creation was steered by the guiding hand of artificial intelligence. Our curiosity led us to inquire about how likely folks would be to give it a watch. We had Americans rate their interest on a scale from 1 to 10, and here’s what we found.
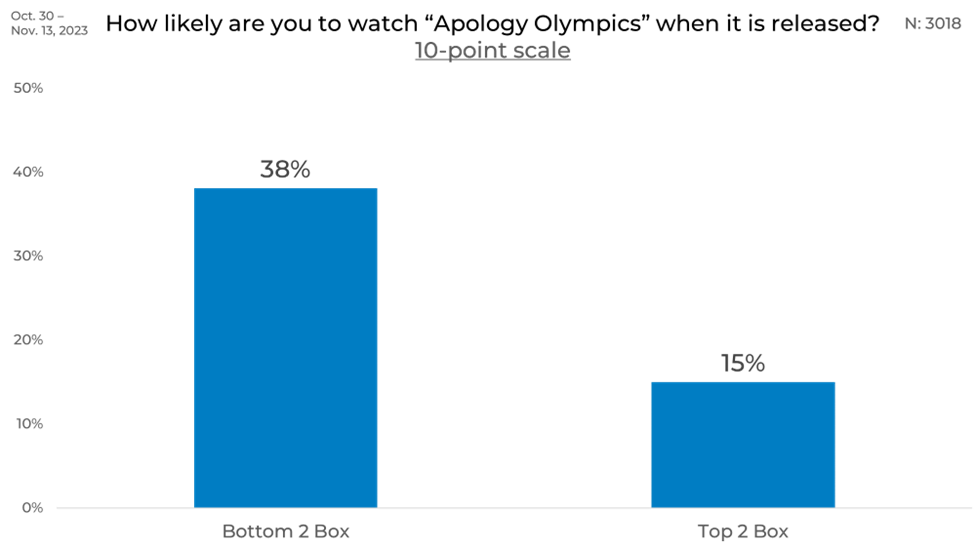
A solid 38% of folks weren’t exactly jumping out of their seats to see it. They ended up in the bottom 2 box, indicating that our AI-generated movie concept, Apology Olympics, didn’t quite strike a chord with them. On the other side of the coin, we’ve got just 15% in the top two boxes – not great. Looks like our movie might need a bit of movie magic to get the audience cheering, eh? Perhaps this movie will be more popular among Canadians.
Gender
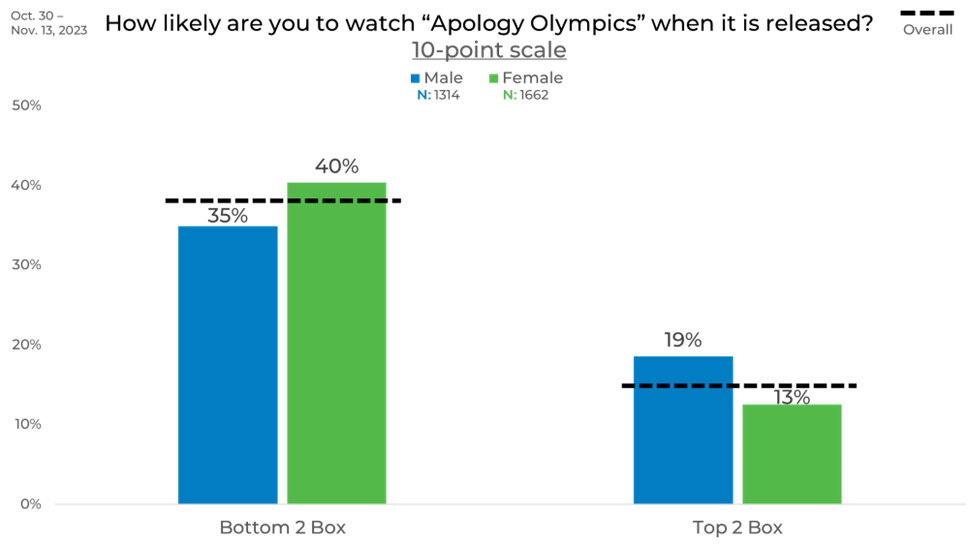
Now, let’s look at how gender influences the anticipation for our fictional movie, “Apology Olympics.” This cinematic concoction appears to have a slightly warmer reception among the male audience, with 6% more of them landing in the top two boxes. Conversely, females showed a 5% higher likelihood of ending up in the bottom two boxes.
Age
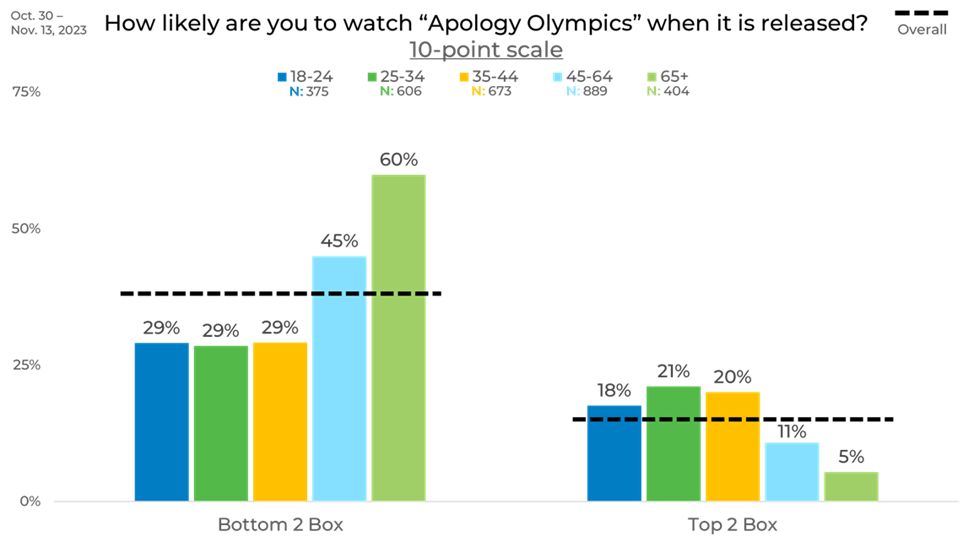
The older demographic, those aged 65 and above, showed the slightest interest, with a whopping 60% finding themselves in the bottom 2 boxes. This level of disinterest stood out significantly, being a striking 31% higher compared to the younger age group, ages 18-44. Following closely, people aged 45-64 were the second most likely to lack interest in the movie, with 45% landing in the bottom two boxes.
On the flip side, the age group of 25-34 demonstrated the most interest, with a notable 21% landing in the top two boxes. This group’s enthusiasm was a substantial 16% higher than people aged 65 and above.
Income
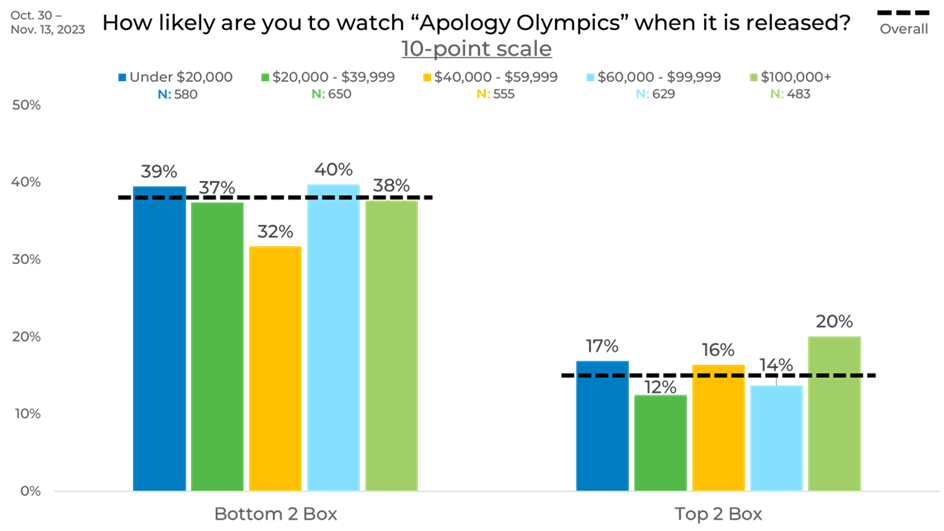
Regarding income levels and their interest in “Apology Olympics,” some interesting patterns emerge. Those with incomes under $20,000 and between $60,000 and $99,999 showed the slightest interest, at 39% and 40%, respectively.
Surprisingly, the group with incomes between $40,000 and $59,999 appeared to be the least likely to land in the bottom two boxes, with only 32% expressing disinterest. However, they stood out as the third most likely income group in the top two boxes, showing a balanced mix of curiosity and indifference. In contrast, individuals with incomes of $100,000 and above were the most likely to be in the top two boxes, with a notable 20% expressing a keen interest in the movie.
Political Affiliation
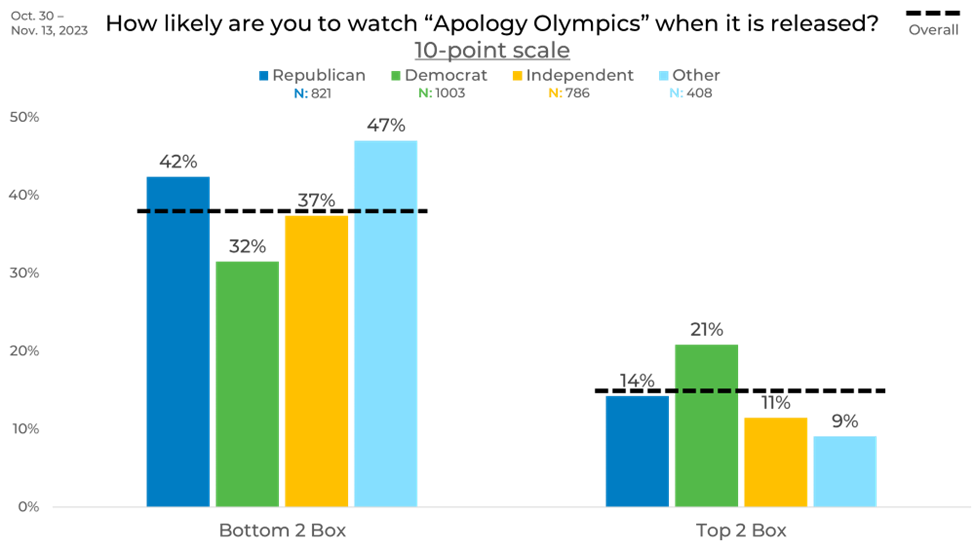
Now, turning our attention to the political landscape, let’s explore how different political affiliations perceive “Apology Olympics.” Within this spectrum, “Other” political parties appeared to be the least enthused, with a substantial 47% of their members finding themselves in the bottom 2 box.
On the flip side of the political coin, Democrats showcased the most enthusiasm, with a solid 21% of their members landing in the top 2 box—this was a noteworthy 7% higher than any other political party.
Ethnicity
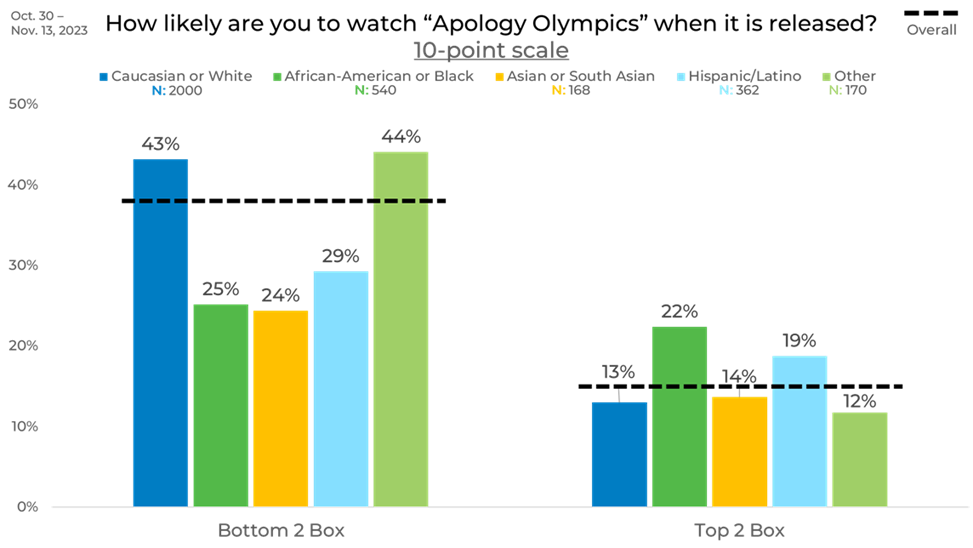
When we consider ethnicity and their interest in “Apology Olympics,” some intriguing trends emerge. Caucasians and “Other” ethnicity groups appeared to show the least amount of interest, with both groups having 43% and 44% of respondents giving a rating in the bottom two boxes. This level of disinterest was notably 14% more likely than any other ethnicity.
In contrast, African Americans displayed the most interest in the movie, with a substantial 22% rating of 9 or 10 for their interest level. This level of enthusiasm was 3% higher than the next closest ethnicity group and a noteworthy 10% more likely than “other” ethnicities.
Region
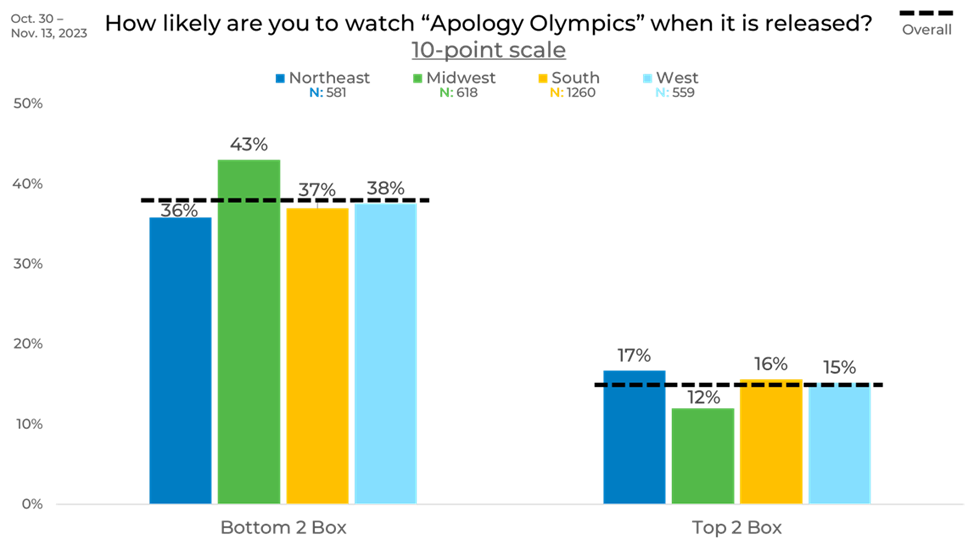
Interestingly, folks in the Midwest displayed the least interest, with a substantial 43% finding themselves in the bottom two boxes. This level of disinterest was notably 5% higher than in any other region. On the other hand, the Northeast, South, and West regions showcased relatively similar sentiments, with 15-17% of respondents in each region landing in the top 2 box. Meanwhile, 36-38% of these regions were in the bottom two boxes.
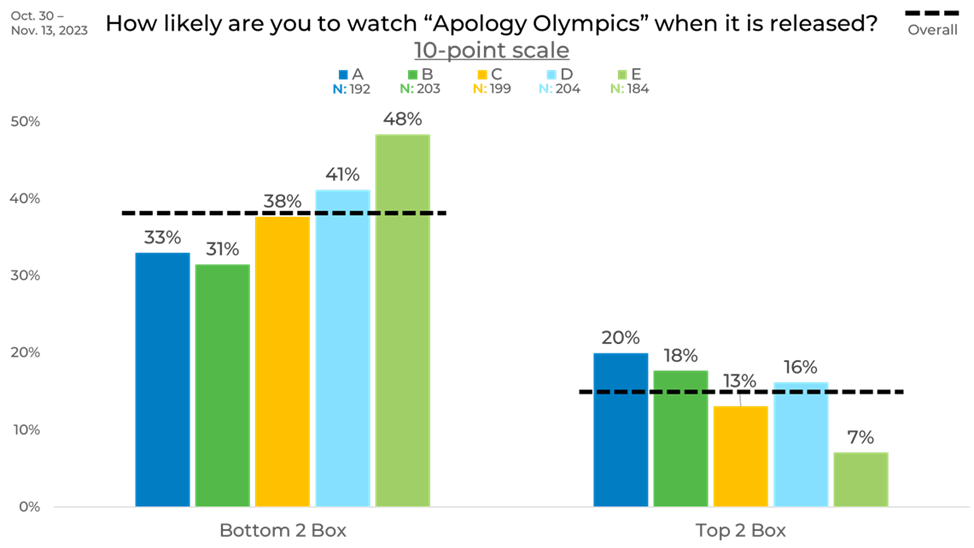
Panel
The most significant difference in interest levels comes from Panels B and E. Panel E stands out as 17% more likely than Panel B to be in the bottom two boxes, indicating a significant lack of interest among respondents in Panel E.
Opting for Panel A might provide some glimmer of hope for developing the movie, as 20% of respondents in this panel were in the top two boxes, demonstrating a certain level of interest. However, suppose you were to choose Panel E. In that case, it becomes abundantly clear that there is minimal interest in the movie, with only 7% being in the top two boxes and almost half (48%) landing in the bottom two boxes.
As you can see, even with an AI-generated movie concept, results can vary significantly by panel. These variations emphasize the necessity of strategic sample blending in research to avoid biases inherent in individual panels. Understanding how panels differ from one another is vital when you depend on a study to make critical business decisions.
Learn more about panel differences in our annual report on the sample industry, The Sample Landscape: 2023 Edition.


