

Intellicast S5E33 – A Rash of Acquisitions in the MRX Industry
October 31, 2022Intellicast S5E34 – A Changing of the Guard At Some MRX Big Hitters
November 11, 2022
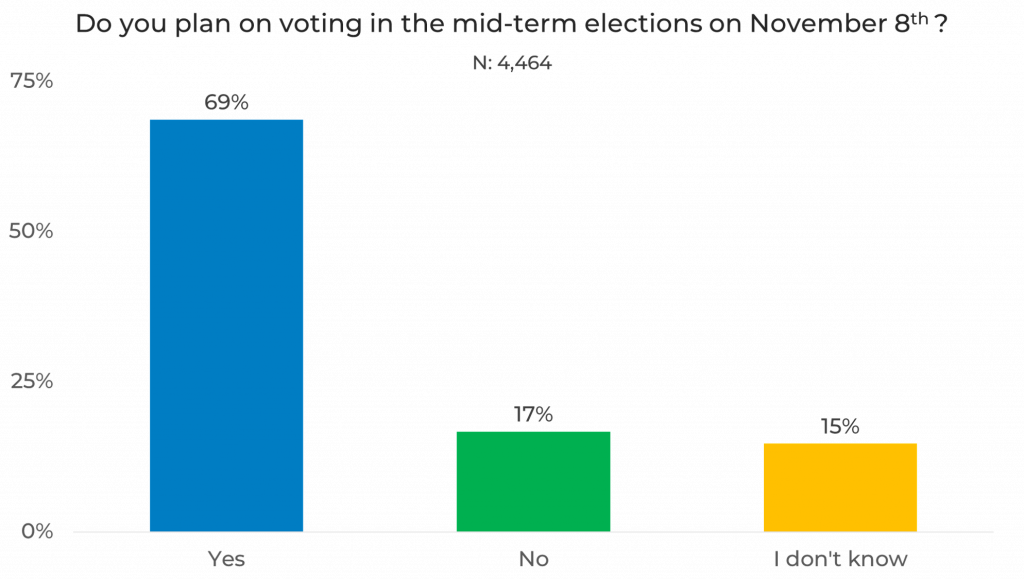
Did you hit the polls this morning or during early voting? Today, November 8th, Americans will vote in the 2022 midterm elections. In our latest round of research-on-research, we asked respondents if they plan on voting in the midterms. We fielded this study October 17-31, 2022, among 4,461 respondents. As a note, this data is not weighted to balance to census or to account for the differences in the quota groups.
Overall, we see that the majority (69%) of respondents plan on voting, with 17% not planning on voting. The remaining 15% are undecided on whether they will vote.
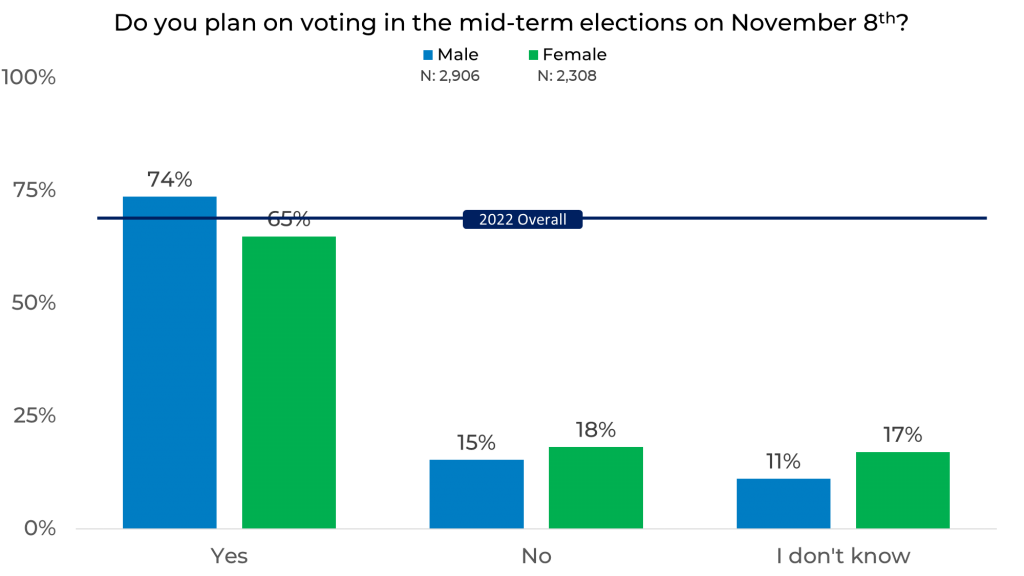
Gender
When looking at likelihood to vote by gender, we see that males are 9% more likely to vote than females. In fact, females are 4% less likely to vote than the overall percentage of respondents who plan to vote (69%.) Females are 6% more likely than males to be unsure of whether they will vote.
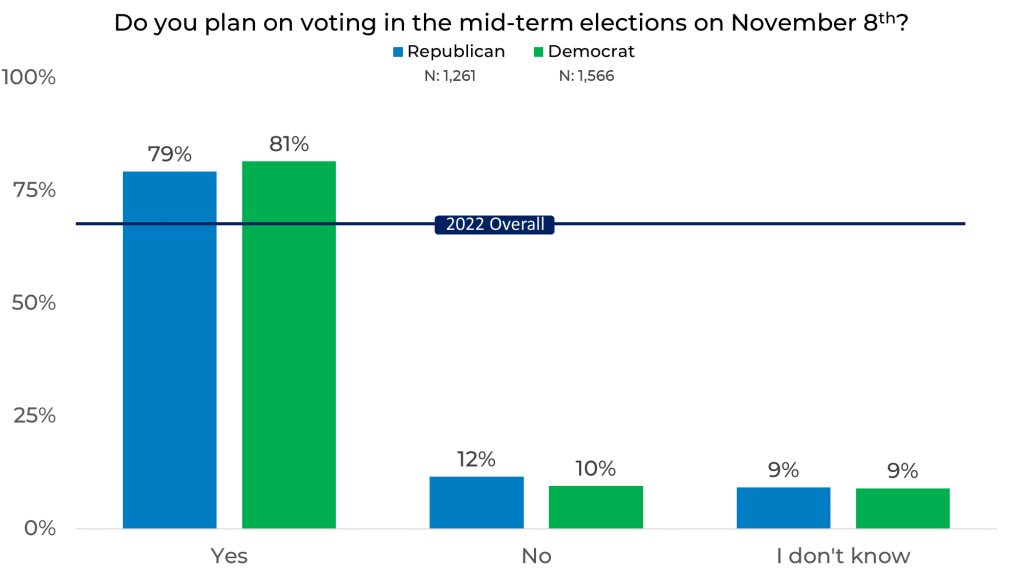
Political Affiliation
When it comes to political affiliation, Republicans and Democrats are 10% and 12% more likely to vote than the overall percentage, respectively.
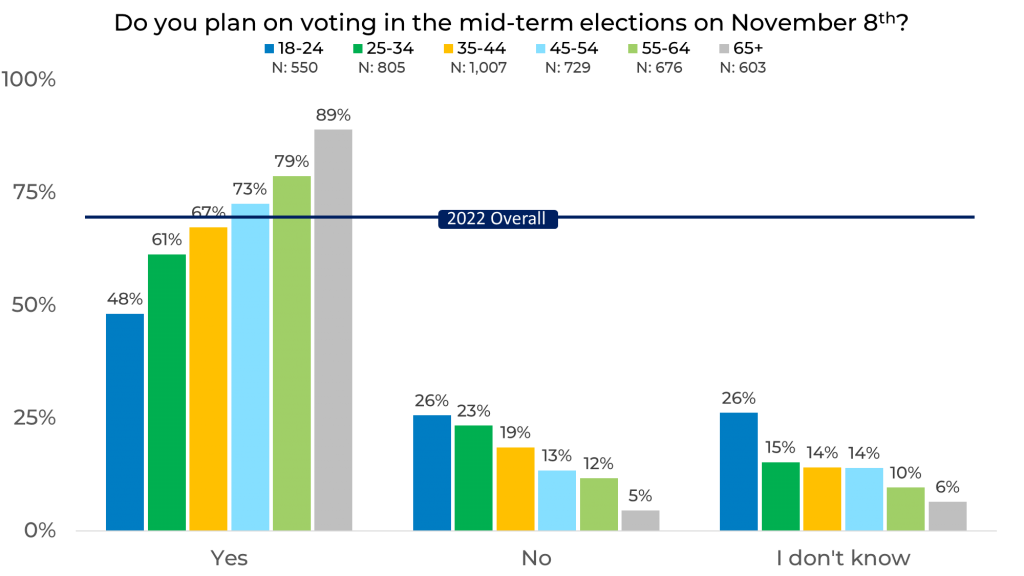
Age
We analyzed respondents by age and found that the older a respondent, the more likely they are to vote in midterm elections. Respondents age 18-44 are less likely to vote than the overall percentage (69%) by 21%, 8%, and 2%, respectively. Respondents age 65+ are 20% more likely to vote than the overall percentage.
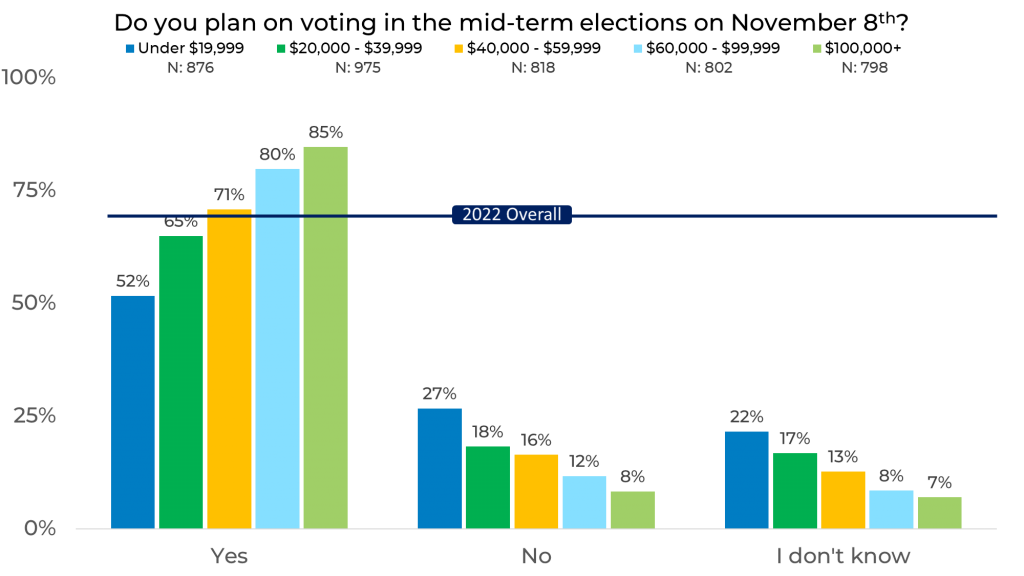
Income
When it comes to income, people with higher incomes are more likely to vote in the midterm elections. Those with incomes of $100,000+ are 16% more likely to vote than the overall percentage (69%.) The lower the income a person has, the more likely they are to be undecided on whether they will vote.
Panel
Finally, we looked at likelihood to vote by panel. We see up to a 36% difference between panels in percentage of respondents who plan to vote on November 8th. We also see responses up to 15% higher and 21% lower than the overall percentage (69%.) These differences can be due to variation in panel makeup, management, and more. The difference can have a significant impact on your data.
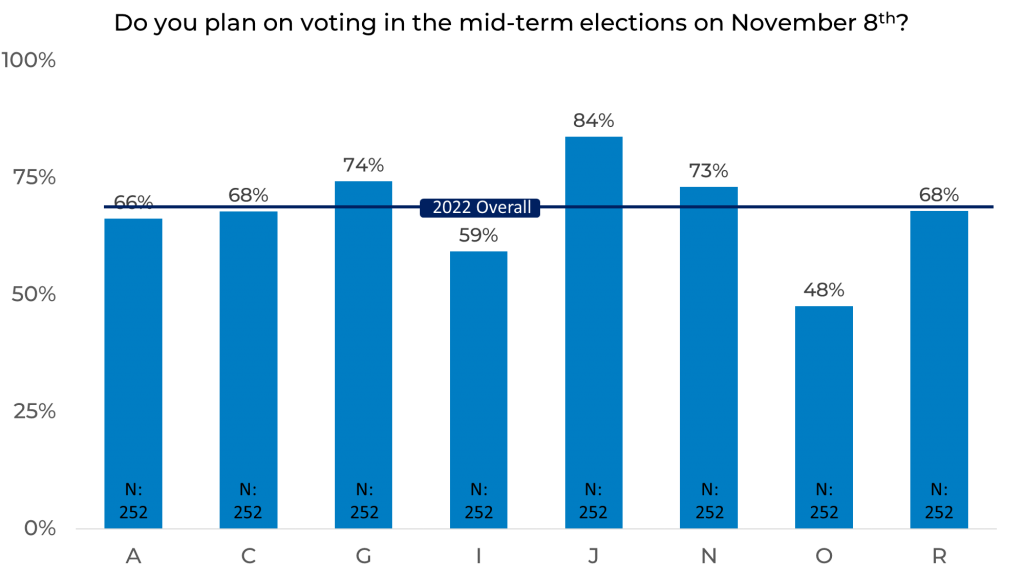
As we see in this blog, responses vary by demographic and panel. Using only a single sample source for your data can be a huge risk as it can lead to sample bias. After all, a candidate would not want to rely on 84% of their supporters voting when only 48% cast a ballot. That is why strategic sample blending is the best practice to ensure your data is safe from sample bias. To learn more about how panels are different, download your copy of The Sample Landscape: 2022 Edition.


