Intellicast S5E26 – Client-Side Research Challenges with Craig Alter of Bon Secours Mercy Health
September 9, 2022Intellicast S5E27 – IMD Preview Part 1 – David Paull and Susan Griffin
September 20, 2022
Jeep, Disney, Coca-Cola. What do these brands have in common? They are some of the first names to populate when you Google search “patriotic brands.” In our latest round of research-on-research, we asked respondents if they perceive two high-profile brands as patriotic, the NFL and The New York Times. We have been tracking public perception of these brands in our research-on-research for four years, so we will also look at how these perceptions have changed over time.
NFL
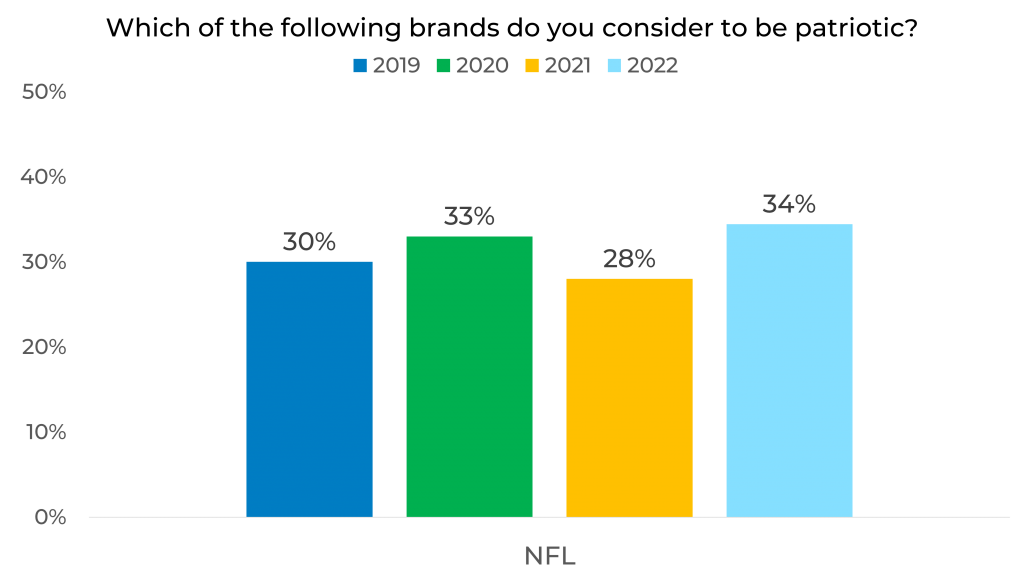
Overall
We have been asking about the perceived patriotism of the NFL since 2019. Overall, in 2022, 34% of people see the NFL as a patriotic brand. This has been the highest percentage of people in the past four years and a 6% increase from 2021.
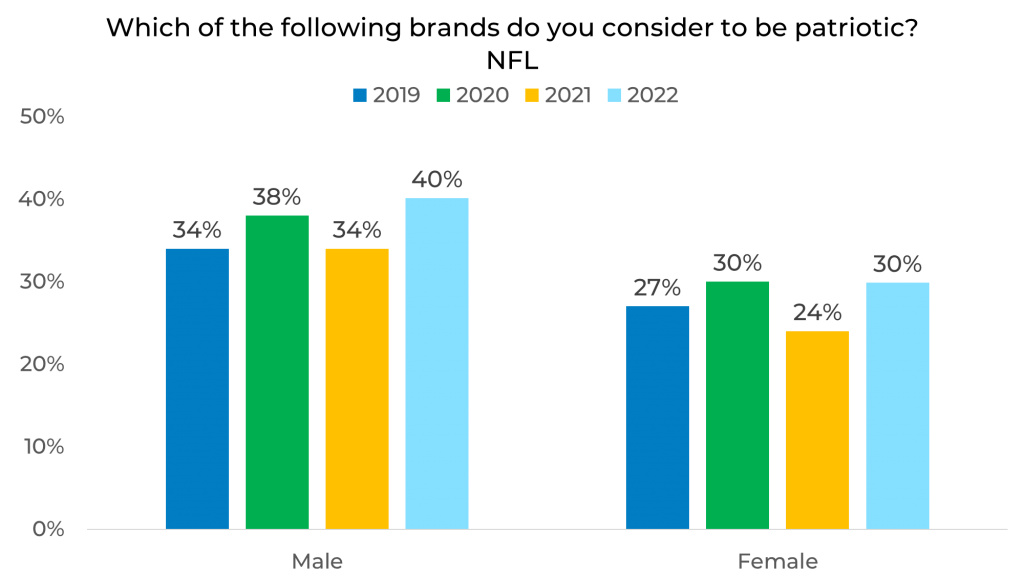
Gender
When looking at the NFL’s brand perception as being patriotic by gender, males are more likely than females to see the NFL as a patriotic brand. In general, there has been a large shift in the past year with both males and females increasing from their lowest scores in 2021 to new heights in 2022, rising six percentage points each.
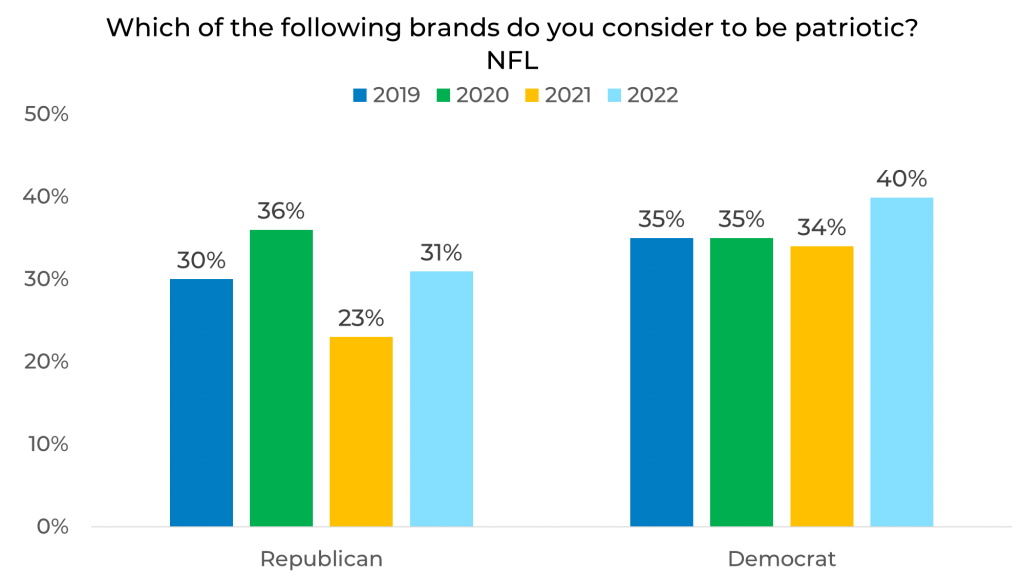
Political Affiliation
We also looked at perceptions by political affiliation. Often, Democrats view the NFL as patriotic more than Republicans, with an average of a 10-point difference over the last two years.
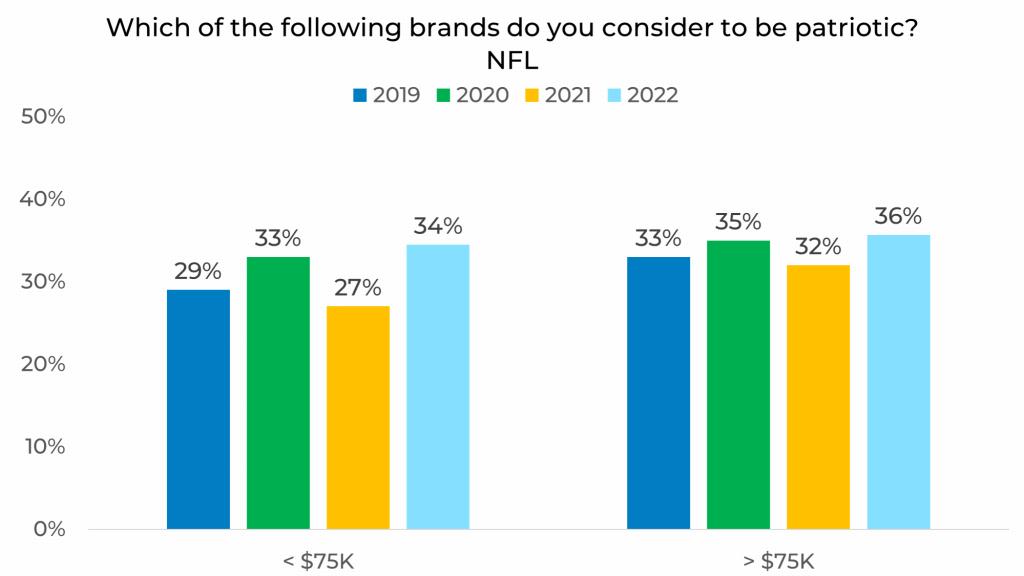
Income
When it comes to income, people with incomes greater than $75k are consistently more likely to believe the NFL is patriotic. We see the greatest change between 2021 and 2022 when there was a 7% increase for those with incomes below $75k, and a 4% increase for those with incomes above $75k in perception of the NFL being a patriotic brand.
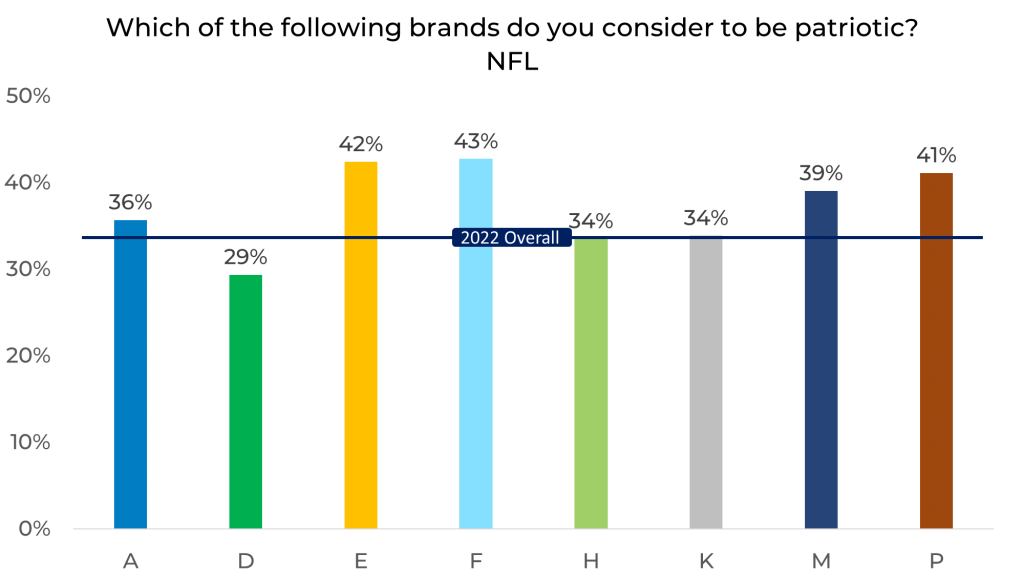
Panel
Finally, we break down the patriotic perceptions of the NFL by panel and the results vary greatly. There is up to a 14-point difference in results depending on the panel. When we looked at overall perception for 2022, 34% of people see the NFL as a patriotic brand. When compared to the results by panel, we can see a difference of up to nine percentage points higher and five percentage points lower. This could be due to differences in panel management, makeup, and more!
NY Times
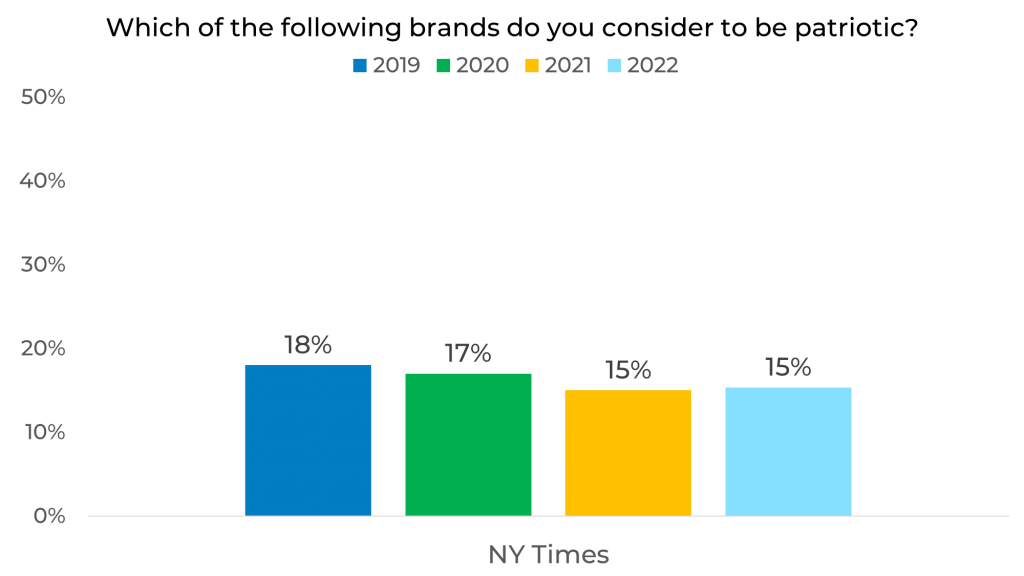
Overall
Overall, the percentage of people who view The New York Times as patriotic has been consistent with only a 3% decrease over the last 4 years.
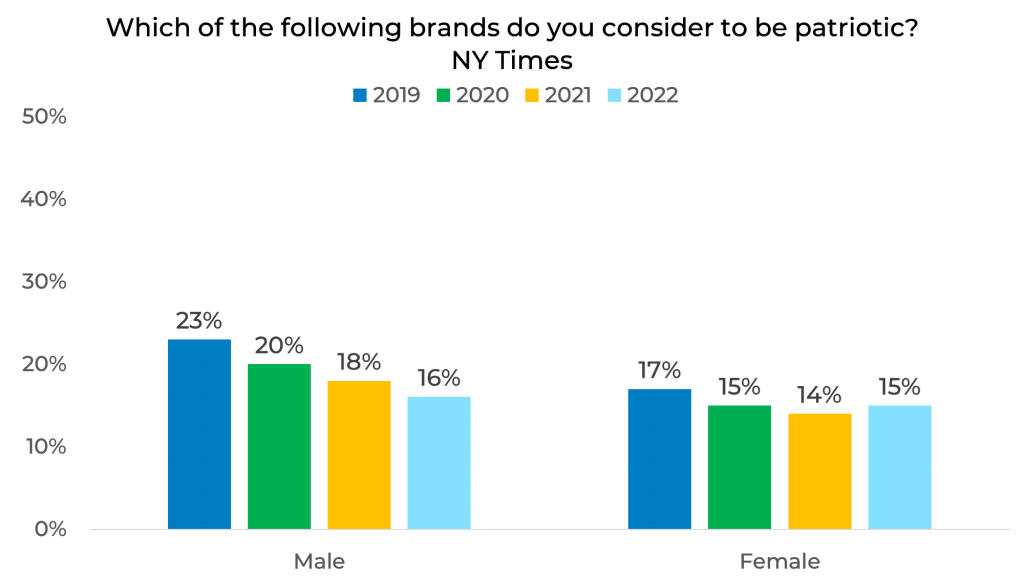
Gender
When looking at perceptions of the New York Times by gender, we see that males are more likely to see the New York Times as patriotic than females. However, the percentage of males that consider the New York Times to be patriotic has decreased 7% from 2019, while females have only decreased 2% since 2019.
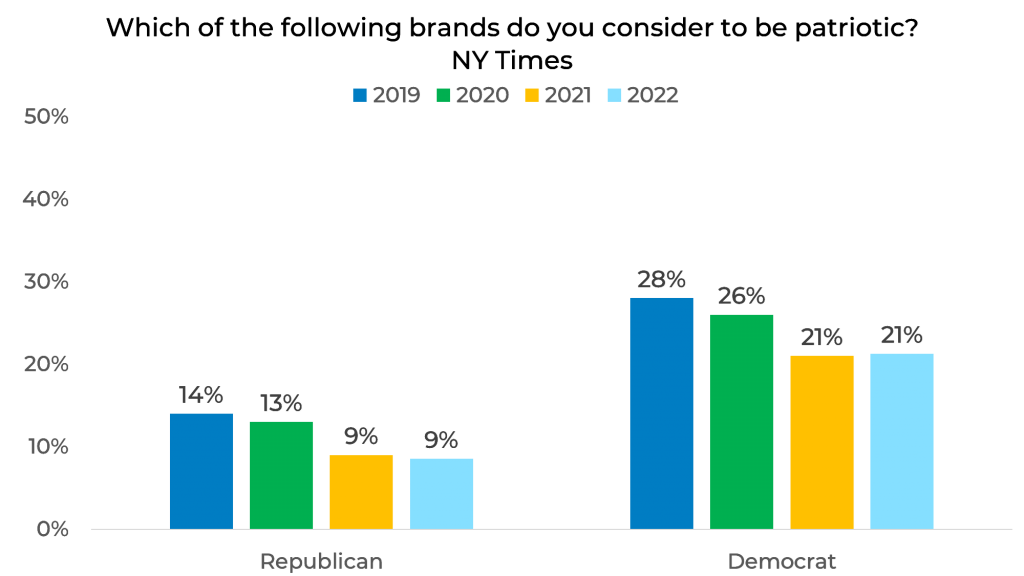
Political Affiliation
We also looked at perceptions of the New York Times by political affiliation. We see that in 2022, Democrats are 12% more likely to consider the New York Times patriotic than Republicans. The percentage of both Democrats and Republicans who consider the New York Times to be patriotic has decreased each year since 2019.
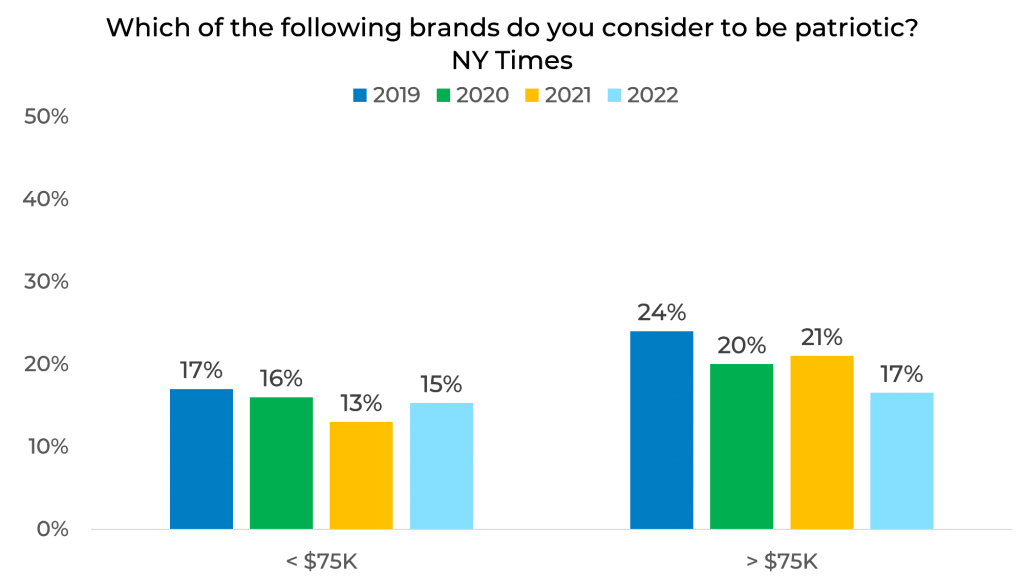
Income
When it comes to income, people with incomes greater than $75k are more likely to consider the New York Times to be patriotic than those with lower incomes. The percentage of people with incomes above $75k who consider the New York Times to be patriotic has decreased 7% since 2019.
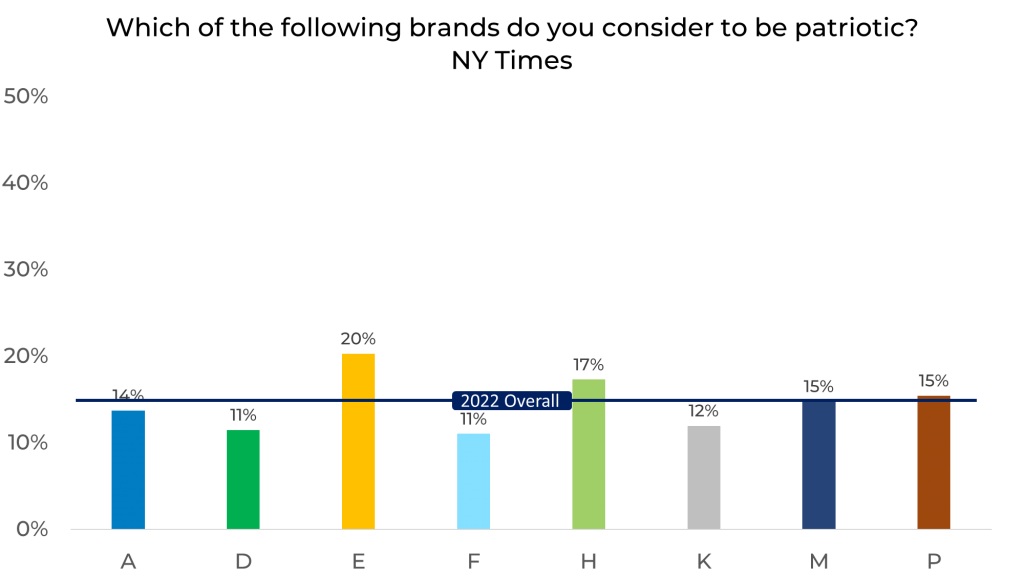
Panel
When we look at perceptions of the New York Times by panel in 2022, we see up to a 9% difference in panels. We also know that overall, 15% of people in 2022 consider the New York Times to be patriotic. However, there is up to a 5% difference from that percentage by panel as seen with Panel E. These differences can have a significant impact on the accuracy of your data.
As we see in this blog, brand perception can vary by both demographic and panel. That is why strategic sample blending is a best practice to ensure your data is safe from sample bias and is consistent over time. This allows you to trust that any changes are due to shifts in the market, not inaccuracies in your data. To learn more about brand perception and how panels are different, download your copy of The Sample Landscape: 2022 Edition.

