
Are We Marching Towards WW3?
April 27, 2026
Support on Policy Doesn’t Equal Support on Enforcement Tactics: A Deep Dive into Opinions on Deportation and ICE Tactics
May 5, 2026
The longest shutdown in history, impacting the Department of Homeland Security (DHS), ended last week, but its reverberations were felt around the country. Air travelers were some of the most impacted by the shutdown as the TSA rolls up under DHS. During the shutdown, there were news stories that circulated describing multi-hour waits to get through airport security, inconveniencing travelers and causing headaches for many. We wanted to get a gauge on the impact the shutdown was having on air travel, so we asked in our most recent wave of research-on-research.
Note: Results are filtered by respondents who indicated they had flew in the last month.
Overall
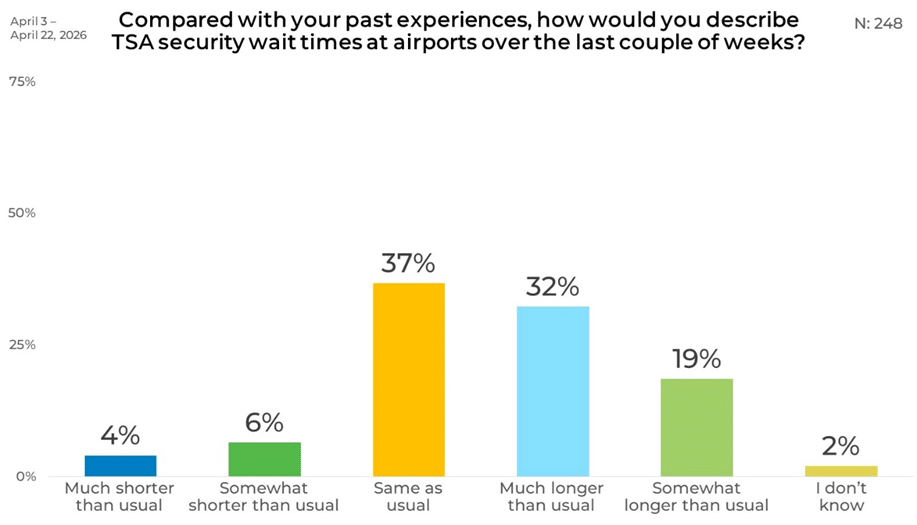
The overall perception among flyers leaned to them experiencing longer wait times. A majority of respondents, 51%, reported that TSA security lines felt longer than usual compared with their past experiences. This share clearly exceeds the 37% who felt wait times were about the same as usual. Only 10% described wait times as shorter than usual.
Gender
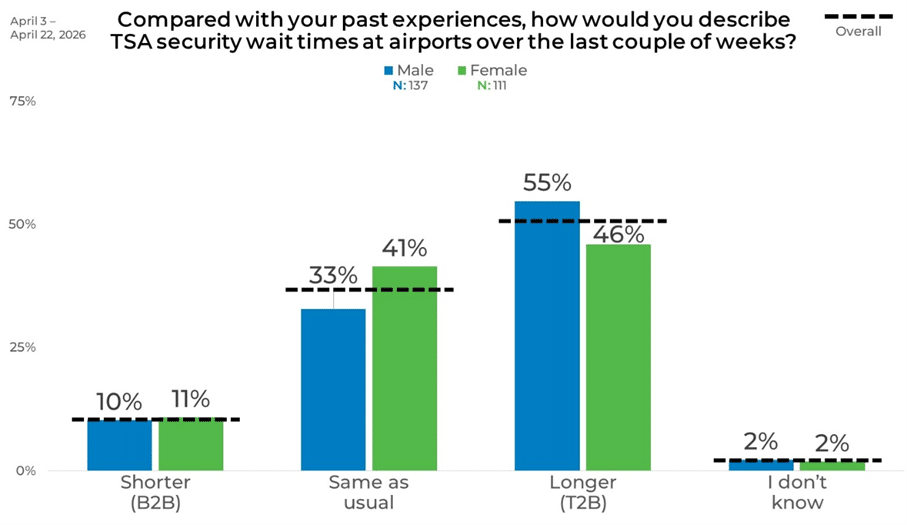
Perceptions of wait times were similar among men and women, though some differences appear in how strongly each group reported longer experiences. Among male travelers, 55% said wait times were longer than usual, compared with 46% of female travelers. Reports of shorter wait times remained limited for both genders, with 10% of men and 11% of women describing shorter experiences.
Age
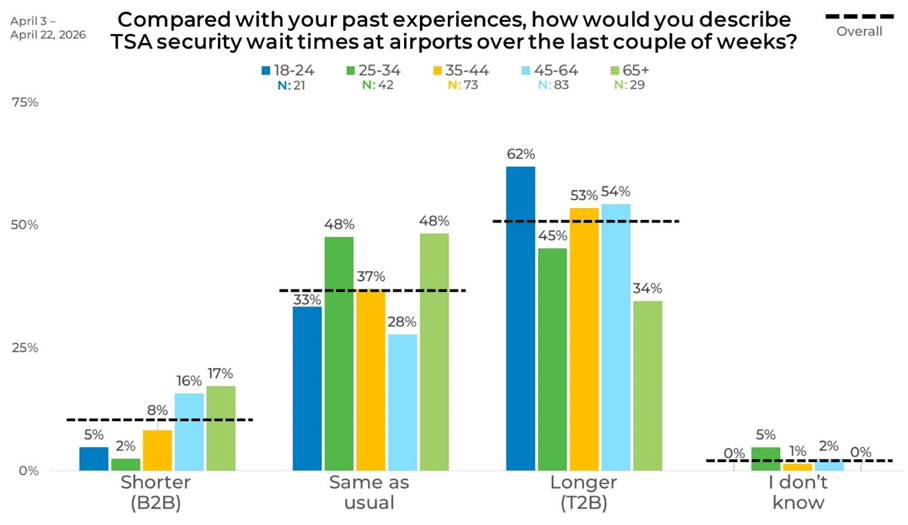
Segmenting the data by age uncovered some interesting insights. Younger adults ages 18–24 reported the highest share of longer wait times at 62%, marking the most pronounced perception of delays among all age groups. Adults ages 35–44 and 45–64 also showed majorities reporting longer waits, at 53% and 54% respectively. In contrast, adults 25-34 and those 65+ reported the highest levels of wait times being similar to as they had been in the past, with 48% for each age group.
Income
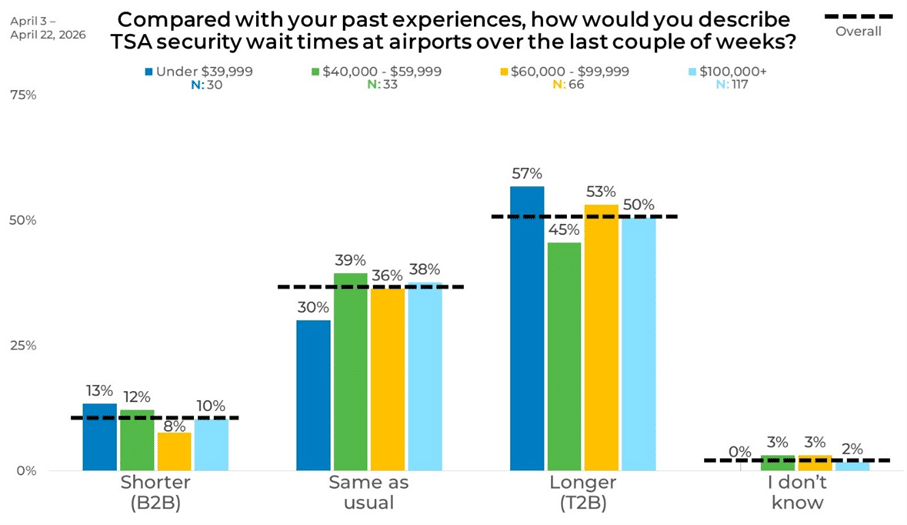
Across income levels, perceptions of longer wait times remained the most common response. Households earning under $39,999 recorded the highest share reporting longer waits at 57%, while those earning $60,000–$99,999 followed at 53%. Higher-income households earning $100,000 or more reported slightly lower levels at 50%, though still representing half of respondents.
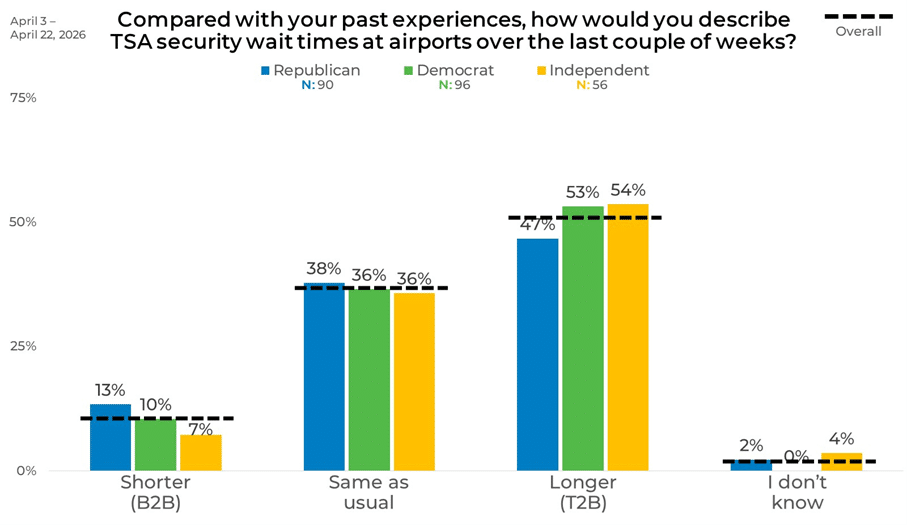
Political Affiliation
Segmenting the data by political affiliation enforced the perception that wait times were longer, with sonly slight differences in the rates by affiliation. Independents (54%) and Democrats (53%) reported slightly higher shares than Republicans (47%).
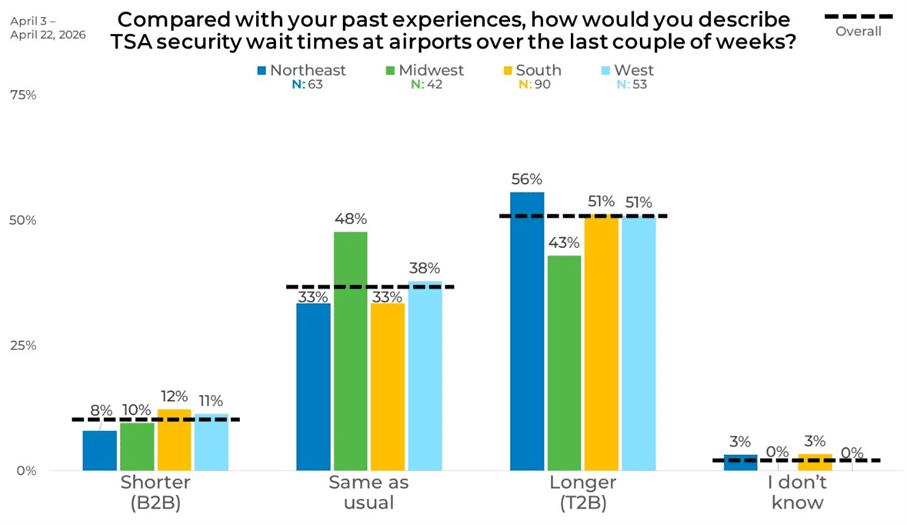
Region
Breaking down the data by region uncovered large differences in the perceptions of wait times at TSA. The Northeast recorded the highest share reporting longer waits at 56%, while both the South and West reported identical levels at 51%. In contrast, the Midwest stood out with a lower share reporting longer waits at 43%, paired with the highest share saying wait times were the same as usual at 48%. This highlighted that where a respondent lived, the airport they were close to had a large impact on the wait times they experienced.
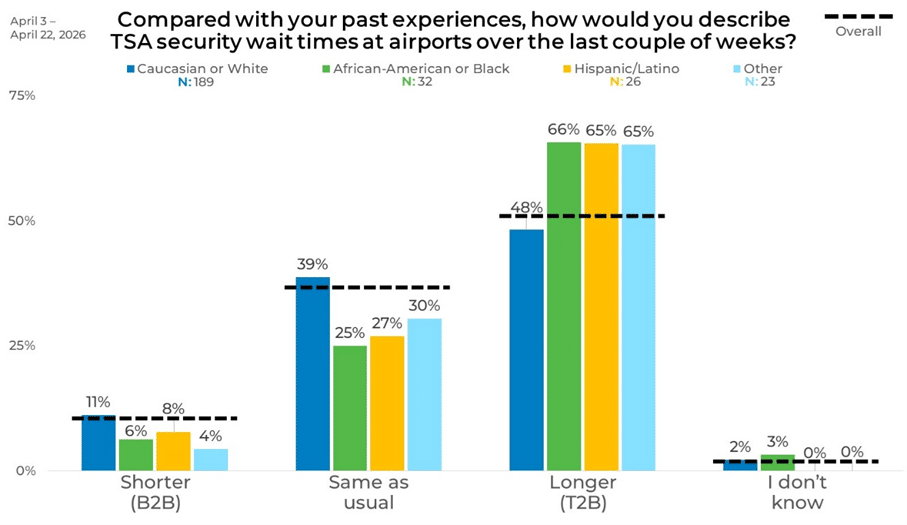
Ethnicity
Perceptions of longer wait times were especially pronounced among several ethnic groups. African Americans reported the highest share describing longer waits at 66%, followed closely by Hispanics at 65%. In comparison, Caucasians reported a somewhat lower share at 48%, though longer waits still represented the most common response within that group.
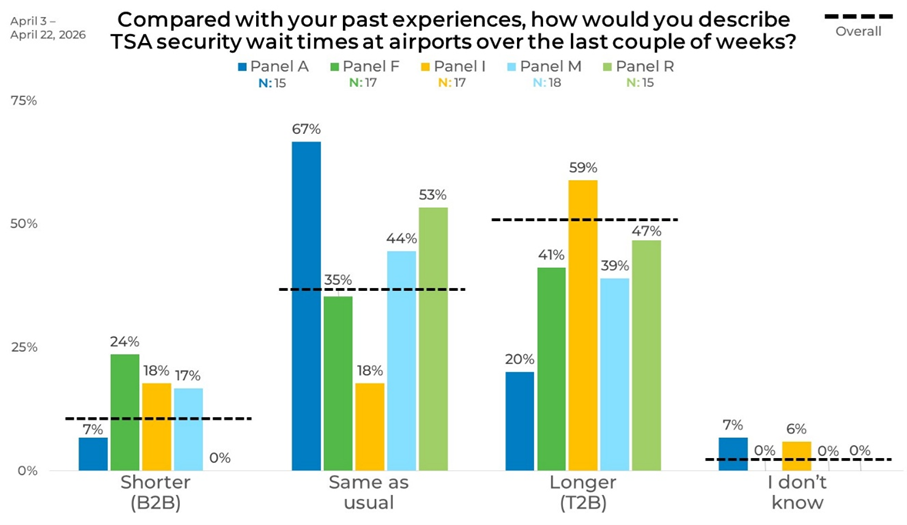
Panel
As with many of the topic we study, panel source had the largest differences in perceptions of TSA wait times, with the largest difference appearing between Panel I and Panel A. Panel I recorded the highest share reporting longer wait times at 59%, while Panel A reported a much lower share at 20%, paired with the highest share saying wait times were the same as usual at 67%. Panel R (47%) and Panel F (41%) fell between these two points, reinforcing the spread across panels. Surprisingly, nearly a quarter of the respondents from Panel F reported that their wait times were shorter.
These results reinforce the need to strategically blend your sample sources rather than depending on a single source. To learn more about EMI’s approach, click the button below.


