
How AI Is Transforming Market Research for Modern Businesses
April 20, 2026
Are We Marching Towards WW3?
April 27, 2026
On February 28, 2026, the United States began military strikes on Iran. These strikes have caused ripples globally and have been divisive among US consumers. We wanted to better gauge the levels of support people currently have for the military operations, so we asked them in our most recent round of research-on-research.
Let’s see what we uncovered.
Overall
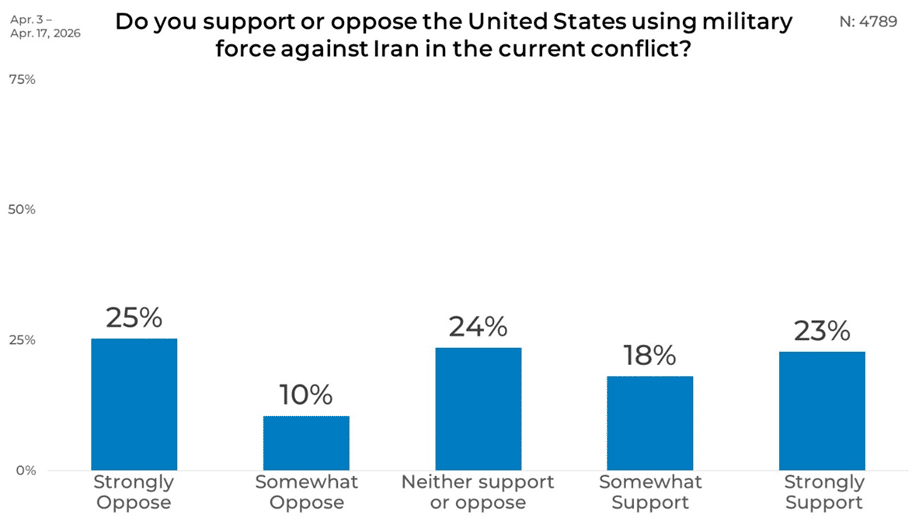
Opinions on the use of military force against Iran are relatively evenly distributed among all US consumers. Opposition accounts for 35% of responses when combining strongly and somewhat oppose, while 41% fall into the support category.
Gender
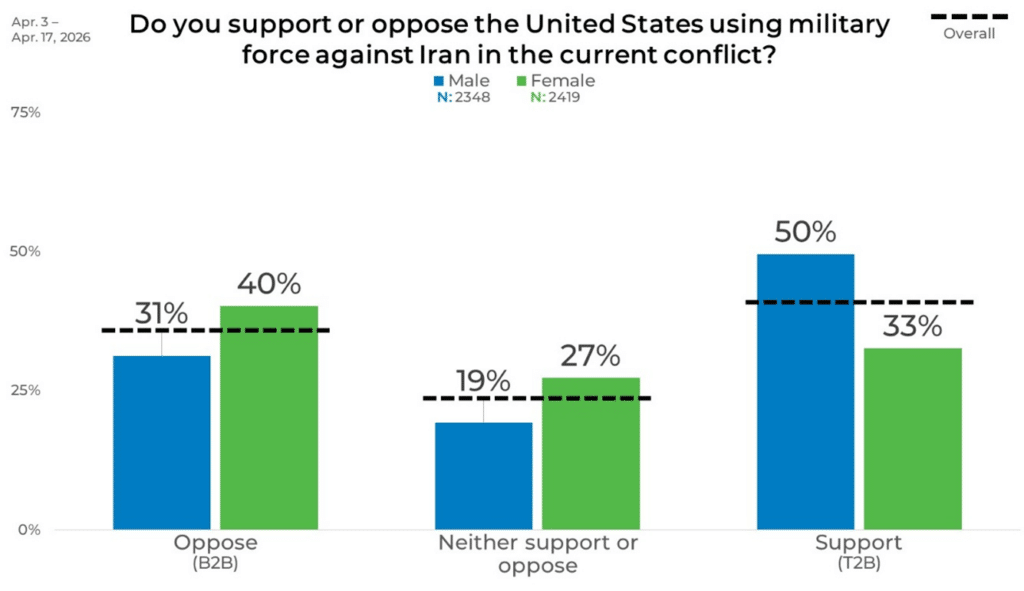
Segmenting the data by gender highlights a clear pattern around support for the military action in Iran. Among men, half of respondents (50%) fall into the support category, compared with 33% of women. Opposition is also more common among women, with 40% in the B2B group versus 31% among men.
Age
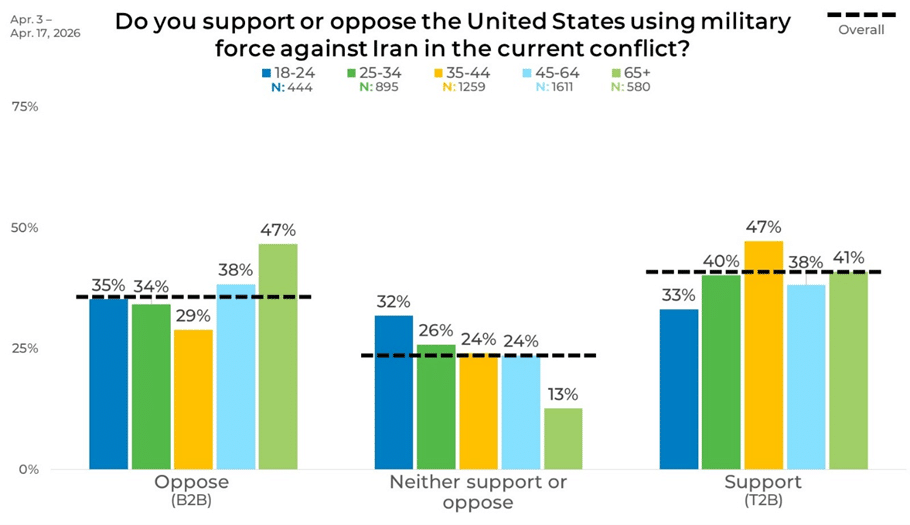
Age has some slight correlations with support. Opposition increases with age, rising from 35% among those ages 18–24 to 47% among those 65 and older. Support shows a different trajectory, peaking among adults ages 35–44 at 47% and remaining relatively strong among those 65 and older at 41%.
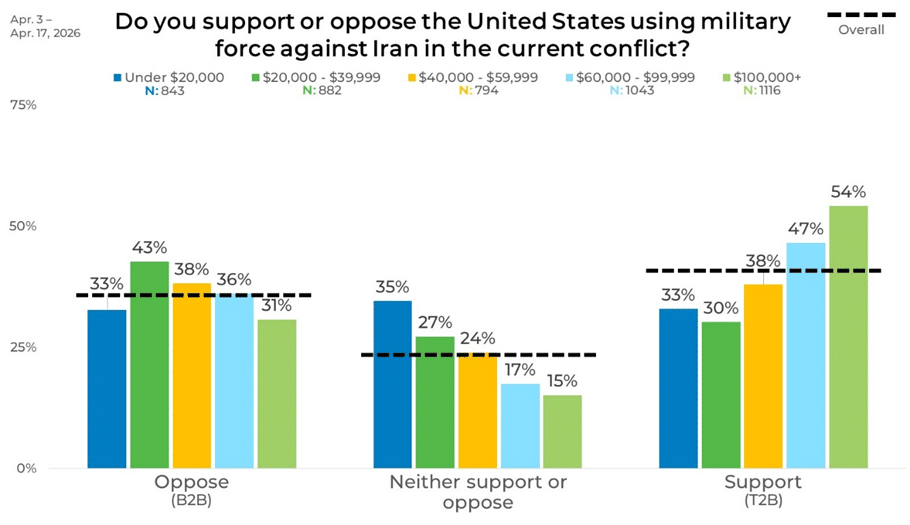
Income
Income levels reveal a noticeable upward shift in support as household earnings increase. . As income rises, the share supporting the use of force grows steadily, reaching 54% among those earning $100,000 or more. At the same time, neutrality declines from 35% in the lowest-income group to 15% in the highest-income group.
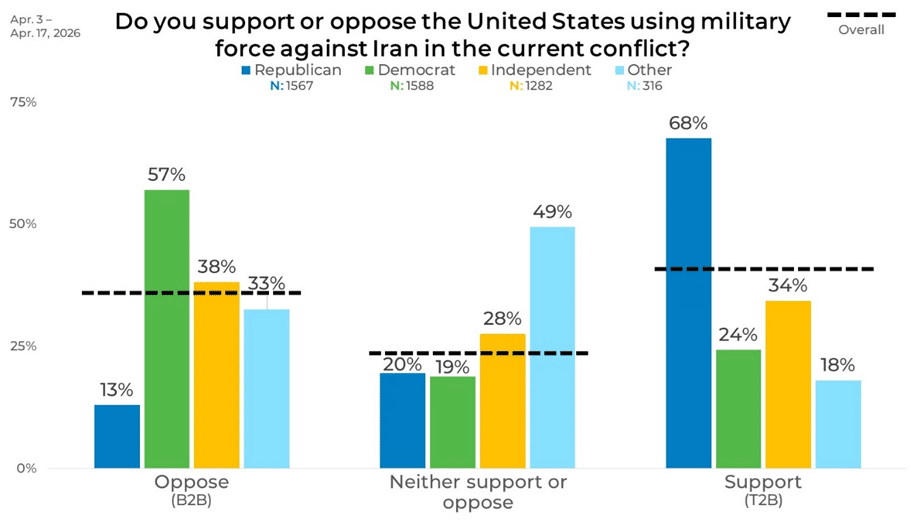
Political Affiliation
Unsurprisingly, political affiliation has some of the widest gaps in support. Republicans are heavily concentrated in support, with 68% in the T2B category and just 13% in opposition. Democrats display the reverse pattern, with a majority of 57% in opposition and only 24% in support. Independents fall between these two groups, with 38% opposed and 34% supportive.
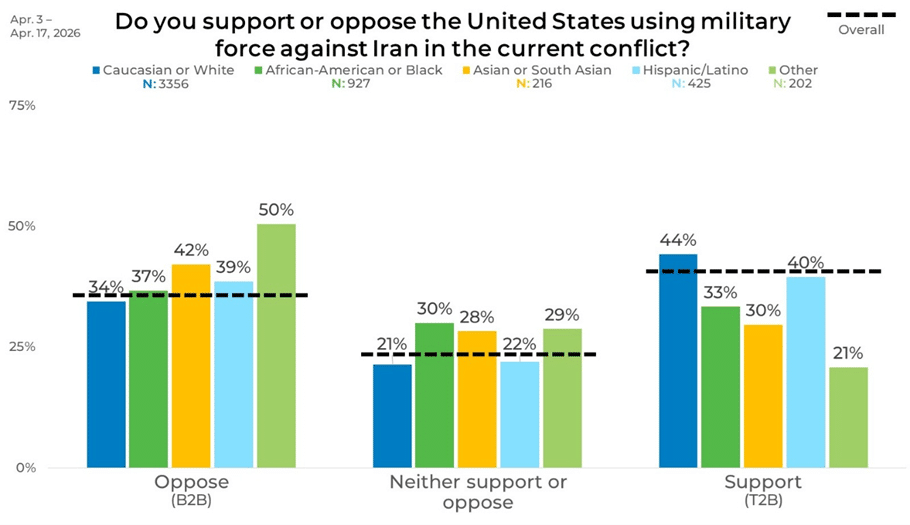
Ethnicity
Support for military action against Iran varies across ethnicities when the data is segmented. Caucasian respondents show the highest level of support at 44%, while Hispanic respondents are closely balanced between opposition (39%) and support (40%). African American respondents display a more even distribution, with 37% opposed, 30% neutral, and 33% supportive.
Panel
Some of the largest differences in support was uncovered when we segmented the data by panel source. Panel W records the highest level of support at 65%, compared with 27% in Panel Q, while Panel Q shows the highest opposition at 44% versus 15% in Panel W. Panels C, E, and L cluster closer to the middle, each with support around 40% to 46% and opposition between 32% and 41%.
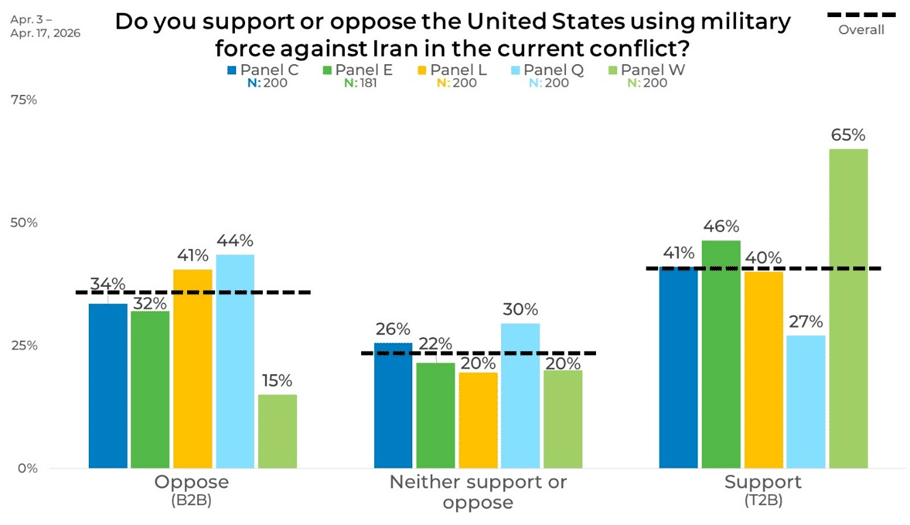
This data highlighted the need to understand the attitudes and behaviors of the panels you use on a study, not just the demographics. Without understanding the attitudes and behaviors, you could bias your data and draw the wrong conclusion.
Find out how EMI can help you with your next study, click the button below to request a consultation with one of our sample consultants.


