
AI-Generated Visual Stimuli: A Smarter Way to Accelerate Early-Stage Concept Testing
October 23, 2026
Democrats Seem to Have the Edge, But the 2026 Midterms Aren’t Over Until the Ballots Are Counted
October 26, 2026
The 2026 midterm elections are just around the corner, and, as with most midterms, voter turnout remains a question mark. How many Americans will cast their vote if the Presidency isn’t on the ballot?
We wanted to gauge potential voter turnout for the midterms, so we asked US consumers in our most recent wave of research-on-research how likely they are to vote in the 2026 midterm election.
Let’s dive in.
Overall
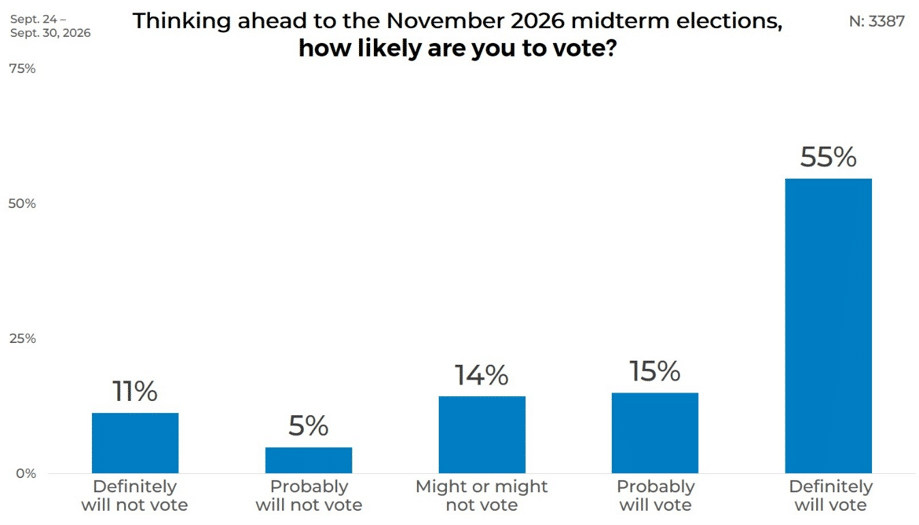
Overall, seven in ten respondents (70%) say they are likely to vote in the upcoming midterm elections, including 55% who definitely plan to vote. Another 14% remain undecided, saying they might or might not participate.
Meanwhile, only 16% indicate they are unlikely to vote.
Gender
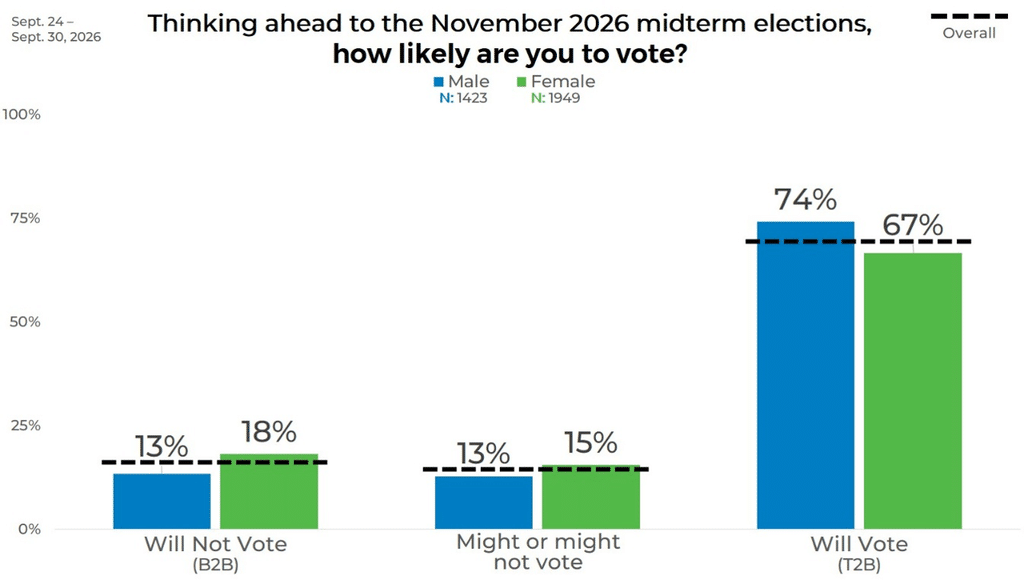
When we segment the data by gender, we see that more males say they intend to vote in the midterm elections, about 7 percentage points higher than females (74% vs. 67%).
Age
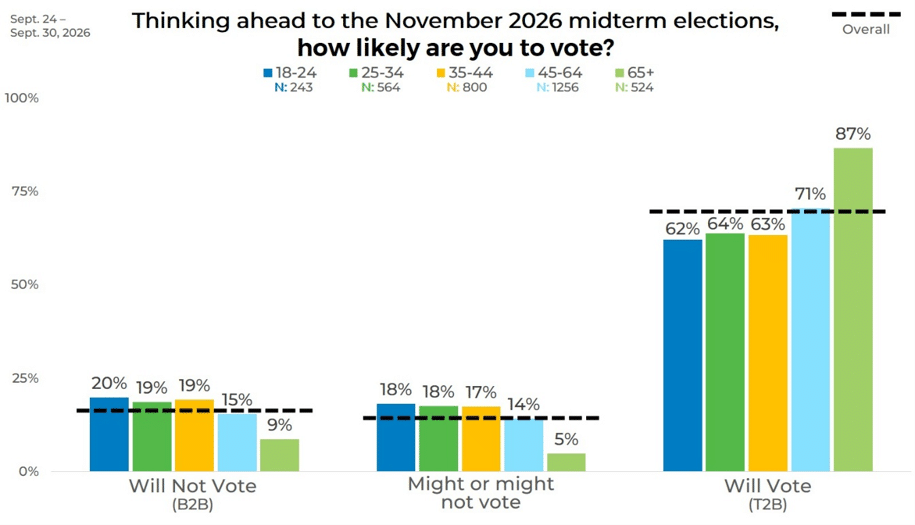
When looking at the data breakdown by age, we see that the percentage of people who say they are likely to vote in the upcoming midterm election increases with age. Across all age groups, the percentage of respondents who say they are likely to vote is over 60%; it rises to 87% among those 65 and older.
Income
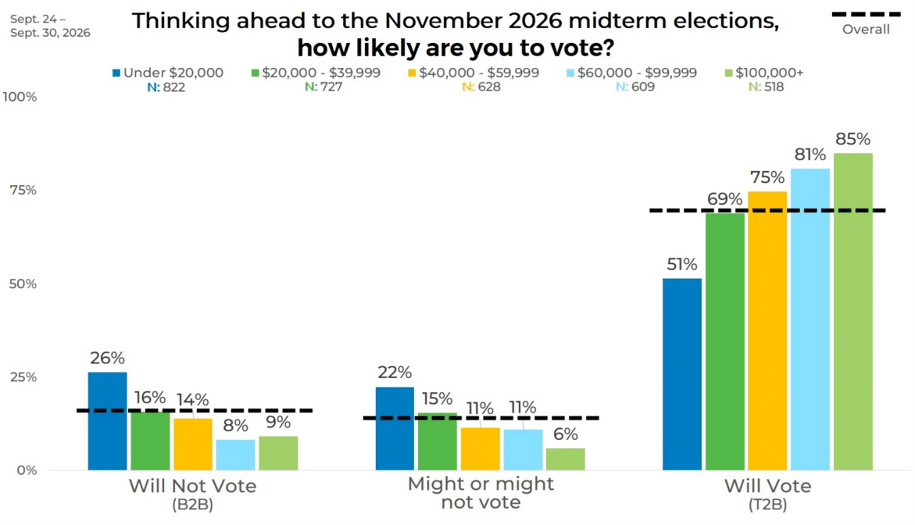
When the data is segmented by income, we see that the percentage of US consumers who say they are likely to vote increases with household income. Among respondents earning under $20,000 annually, 51% say they are likely to vote. That figure rises to 85% among respondents with household incomes over $100,000.
Lower-income respondents also express greater uncertainty and reluctance toward participation. Among those earning under $20,000, 26% say they are unlikely to vote, and 22% remain undecided. By comparison, among respondents earning $100,000 or more, only 9% say they are unlikely to vote, and 6% are undecided, creating a 34-percentage-point gap in voting intentions between the lowest- and highest-income groups.
Political Affiliation
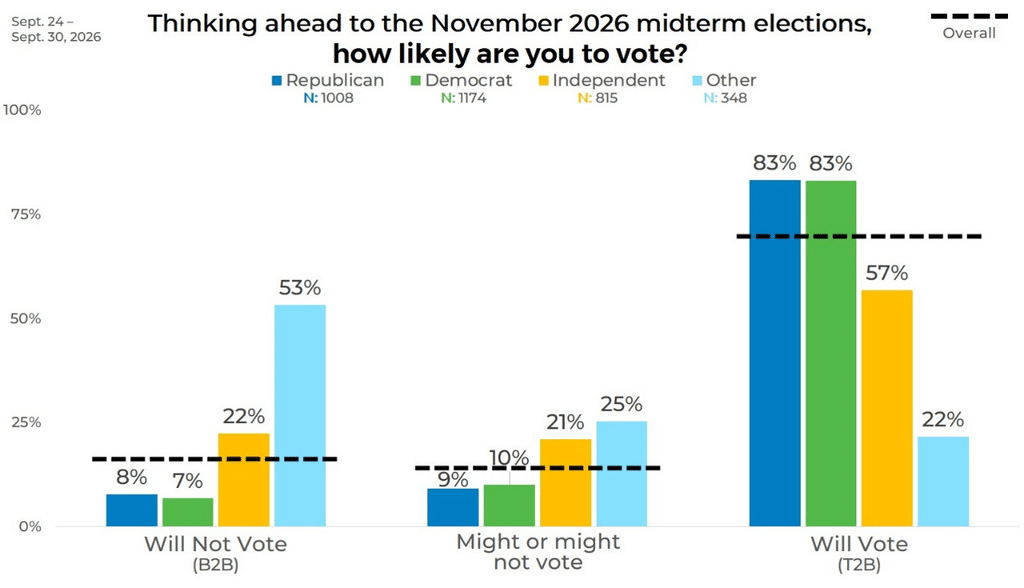
The likelihood of voting for the two major parties is identical, at 83% each. The difference becomes clear when you look at the number of Independents who plan to vote, which is 26 points lower than that of Republicans and Democrats.
Twice as many Independents are unsure whether they will vote as Republicans and Democrats. Nearly three times as many Independents plan not to vote as Democrats and Republicans.
Panel
The largest variation in people’s likelihood of voting appears when we break down the data by panel source. There is up to a 21-point difference in the share of respondents who plan to vote by panel source, with Panel H at 80% and Panel T at 59%.
One would expect Panel T to have the largest number of respondents who don’t plan to vote since they have the small number planning to do so. But that is not the case. They actually have nearly twice as many respondents who are currently undecided (23%).
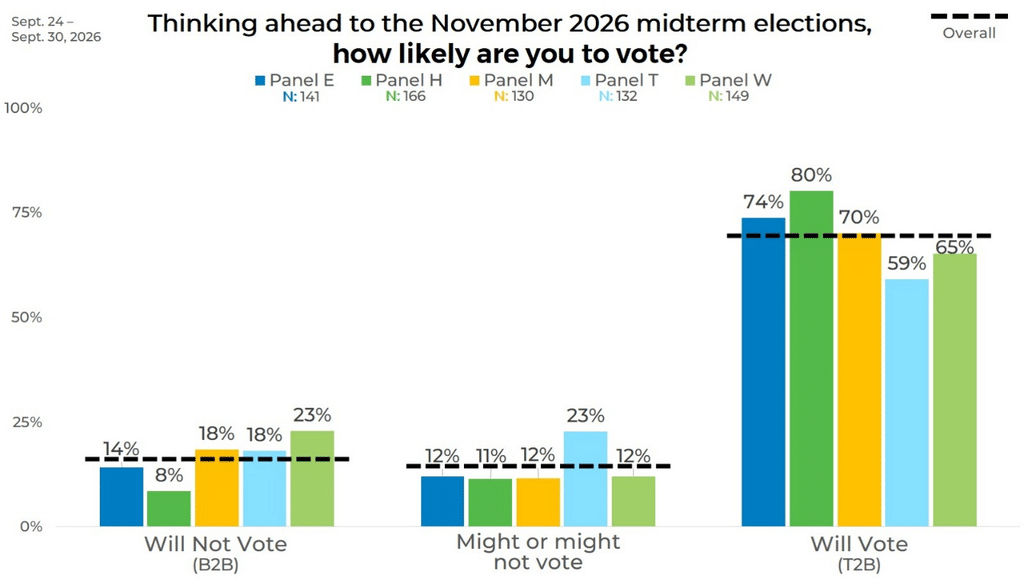
This data highlights the bias you could introduce if you are not strategically blending your sample sources. It could give you a rosier outlook than it truly is, or a darker one that reflects reality.
To learn how strategic sample blending can help you, click the button below.