
Intellicast S8E2: Movers and Mergers
February 24, 2025A New Data Quality Report, A Data Quality Pledge, and a Preview of Quirks Chicago
March 14, 2025St. Patrick’s Day is next week, and how people celebrate varies widely, with some enjoying traditional festivities while others opt out entirely. A significant portion of the population does not celebrate the holiday, but among those who do, popular activities include enjoying Irish food and drinks, visiting bars or pubs, and attending parades or festivals.
In our most recent round of research-on-research, we wanted to find out how people plan on celebrating the day dedicated to the patron saint of Ireland and Irish culture.
Overall
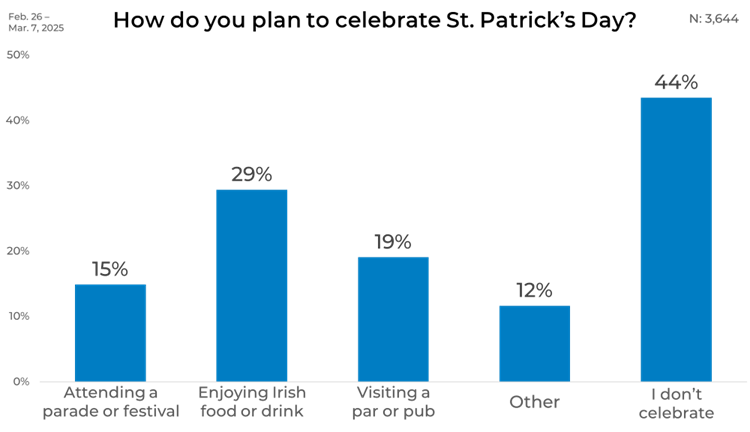
About 44% said they don’t celebrate St. Patrick’s Day. Of those who do, the most popular activity is eating Irish food or drinking Irish beverages (29%). Other common ways to celebrate include going to a bar or pub (19%), where people may gather with friends to enjoy drinks like Guinness or green beer. Attending a parade or festival (15%) is another popular option, with many cities hosting large-scale events featuring floats, marching bands, and cultural performances.
Gender
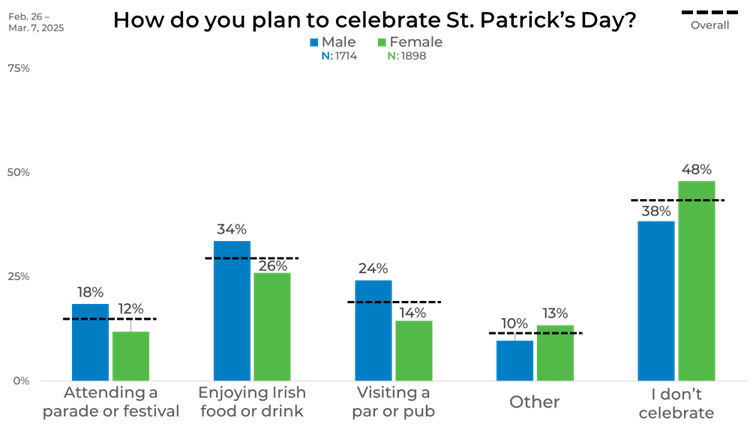
Gender plays a role in celebration choices, with men participating more than women in most activities. They are more likely to attend a parade or festival (18% vs. 12%), enjoy Irish food and drinks (34% vs. 26%), and visit a bar or pub (24% vs. 14%). Women are slightly more likely to choose “other” activities (13% vs. 10%) and are more likely not to celebrate at all (48% vs. 38%).
Age
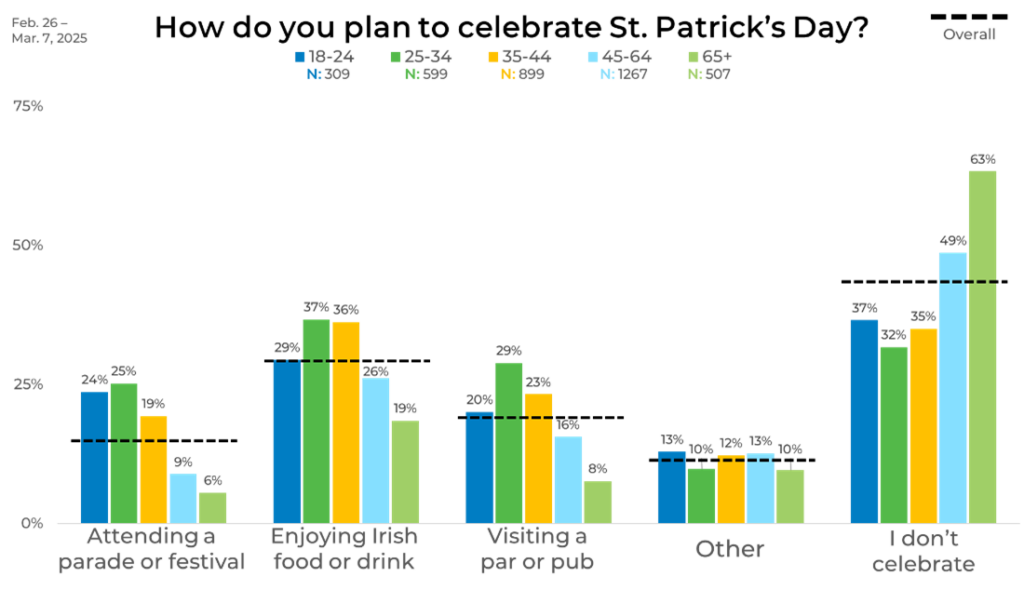
In what should be a surprise to no one, younger age groups are more likely to celebrate St. Patrick’s Day than older groups. Those aged 18-24 and 25-34 are most likely to attend a parade (24% and 25%, respectively). When it comes to visiting a bar or pub, 25–34-year-olds lead at 29%, followed by 35–44-year-olds at 23%. The likelihood of celebrating decreases significantly with age, with only 6% of those 65+ attending a parade and 8% visiting a bar.
Income
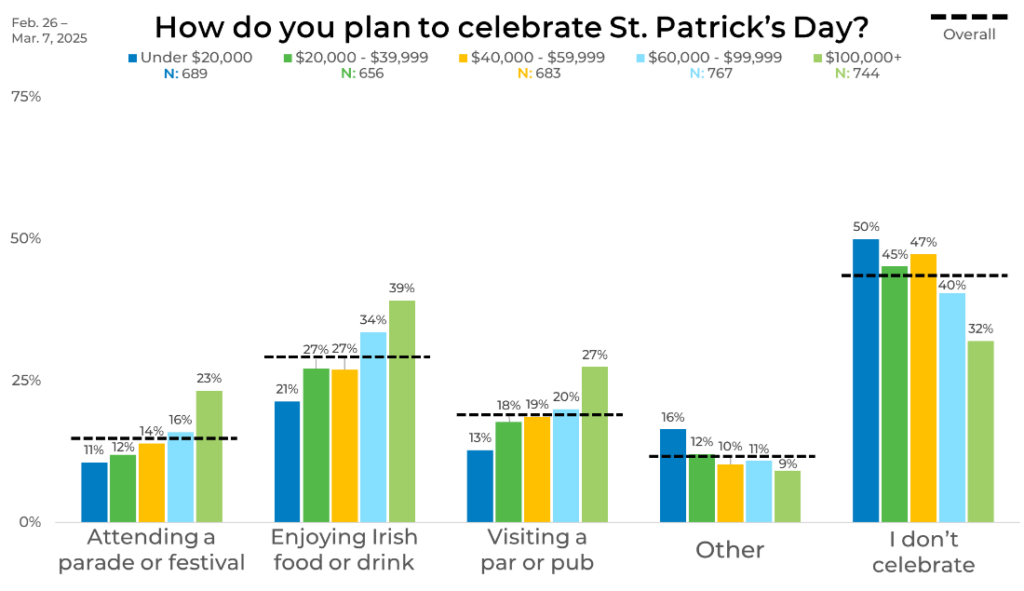
Income levels come into play as people plan and decide how to celebrate St. Patrick’s Day, with higher earners more likely to join the festivities. Among those making $100,000 or more, 23% attend a parade, and 39% indulge in Irish food or drinks. In contrast, half those earning under $20,000 opt out of celebrating altogether. The trend also extends to bar and pub visits, with participation rising alongside income—peaking at 27% among top earners.
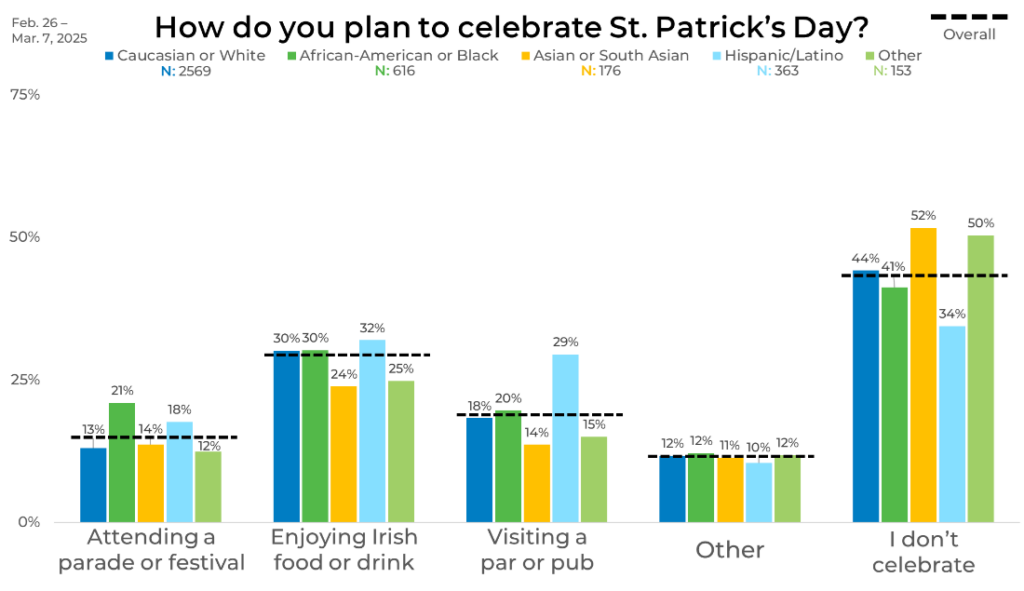
Ethnicity
Ethnicity reveals some surprises about who plans on participating in St. Patrick’s Day festivities. Hispanic/Latino respondents are the most likely to visit a bar or pub (29%) and enjoy Irish food or drinks (32%), strongly engaging with St. Patrick’s Day celebrations. African-American respondents have the highest percentage attending a parade (21%), indicating a preference for public festivities. Caucasian respondents fall close to the overall averages, with 30% enjoying Irish food or drinks and 13% attending parades. Meanwhile, Asian or South Asian respondents are the least likely to celebrate, with 52% opting out, the highest percentage of non-participation among ethnic groups.
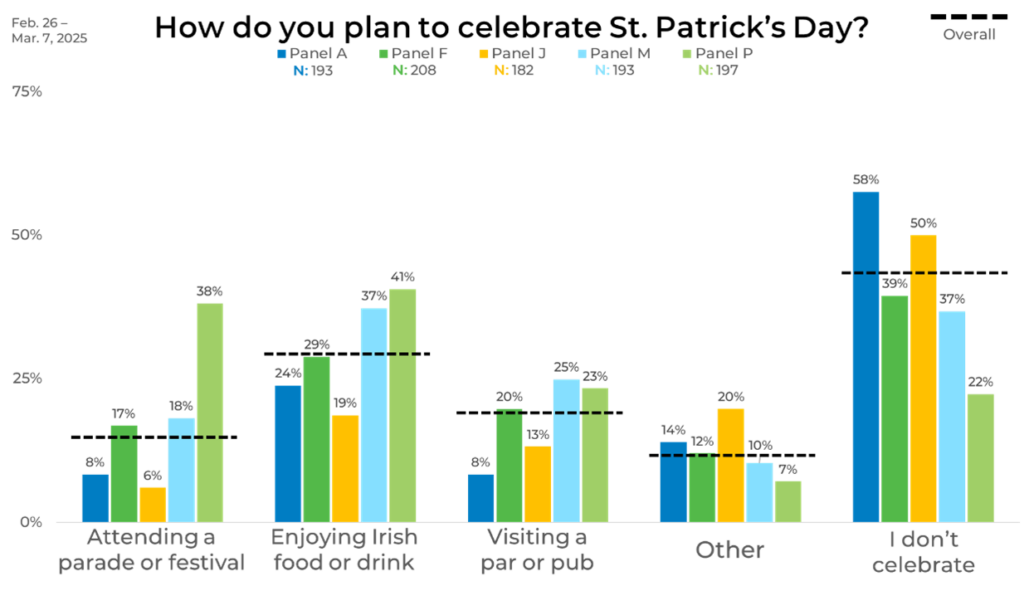
Panel
How people plan on celebrating St. Patrick’s Day varies depending on the panel they are part of. For attending parades, Panel P has significantly higher participation (38%) compared to the much lower rates in Panels A (8%) and J (6%). A similar pattern appears in food and drink celebrations, where Panel P (41%) and Panel M (37%) report higher participation, while Panel J lags at 19%. Visiting bars also vary widely, with Panel M (25%) reporting the highest engagement, while Panel A has the lowest at just 8%. Meanwhile, non-celebration rates range from 22% in Panel P—where participation is strongest—to 58% in Panel A, which shows the least engagement. These variations indicate that different panels capture distinct populations, reinforcing the value of strategically blending panel data.
This data reinforces the importance of strategically blending your panel sources to ensure you capture accurate insights and that individual panels do not skew them. You can learn more about EMI’s unique Strategic Sample Blending approach by clicking the button below.


