
MRX is Growing but at a Slower Rate
July 19, 2024
News That’s Making Waves in the MR Industry
August 12, 2024With the Olympics around the corner, how people choose to watch the events reveals fascinating trends. From live TV enthusiasts to the growing number of online streamers, each demographic group has its own unique preferences. Let’s dive into the latest data to see how viewing habits vary across gender, age, income, and different panels.
General
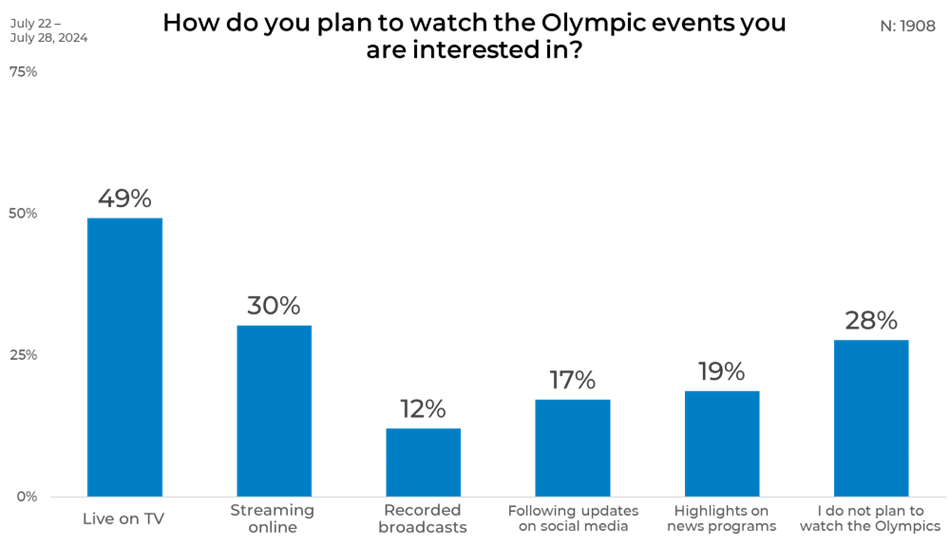
When it comes to watching Olympic events, the preferred method for almost half of the respondents is live TV, with 49% choosing this traditional approach. Streaming online is the next most popular option at 30%, reflecting a significant shift towards digital viewing. Recorded broadcasts attract 12% of the audience, indicating a smaller, but notable preference for flexible viewing schedules. Social media updates and news highlights are also popular, with 17% and 19% respectively opting for these quick, accessible formats. Interestingly, 28% of respondents do not plan to watch the Olympics at all, highlighting a significant portion of the audience disengaged from the event.
Gender
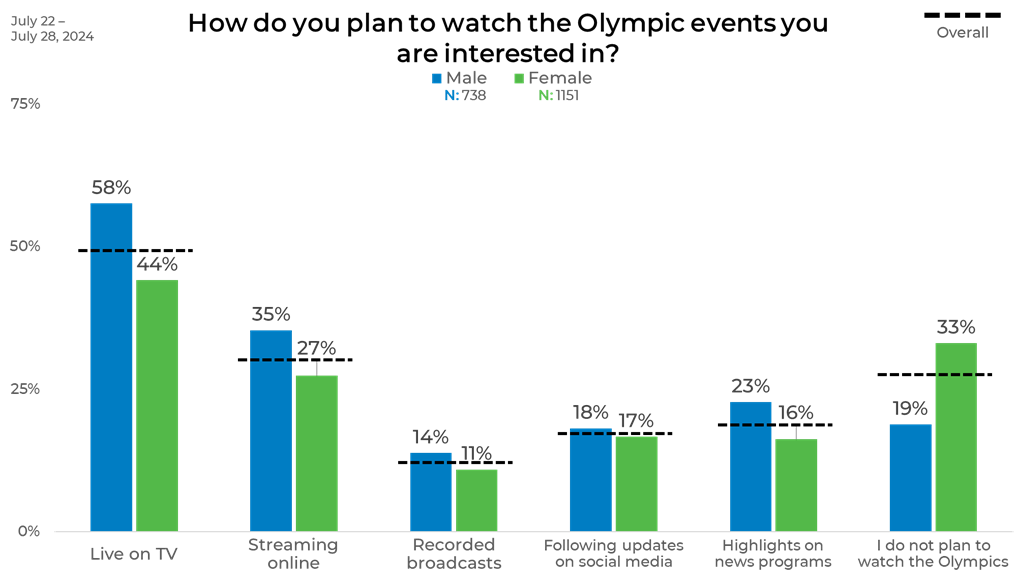
When it comes to watching the Olympics, gender differences paint an intriguing picture of viewing habits. Men seem to be more drawn to traditional live TV, with 58% planning to catch the events as they happen, compared to 44% of women. This trend continues with online streaming, where 35% of men prefer it over the 27% of women. Recorded broadcasts also see a slightly higher preference among men (14%) than women (11%).
Social media updates show a near gender parity, with 18% of men and 17% of women staying informed through their feeds. Men are also more inclined to watch highlights on news programs, at 23% versus 16% for women. Notably, a significant 33% of women do not plan to watch the Olympics at all, nearly doubling the 19% of men who share the same disinterest. This data highlights distinct viewing preferences between genders, reflecting broader trends in media consumption and engagement.
Age
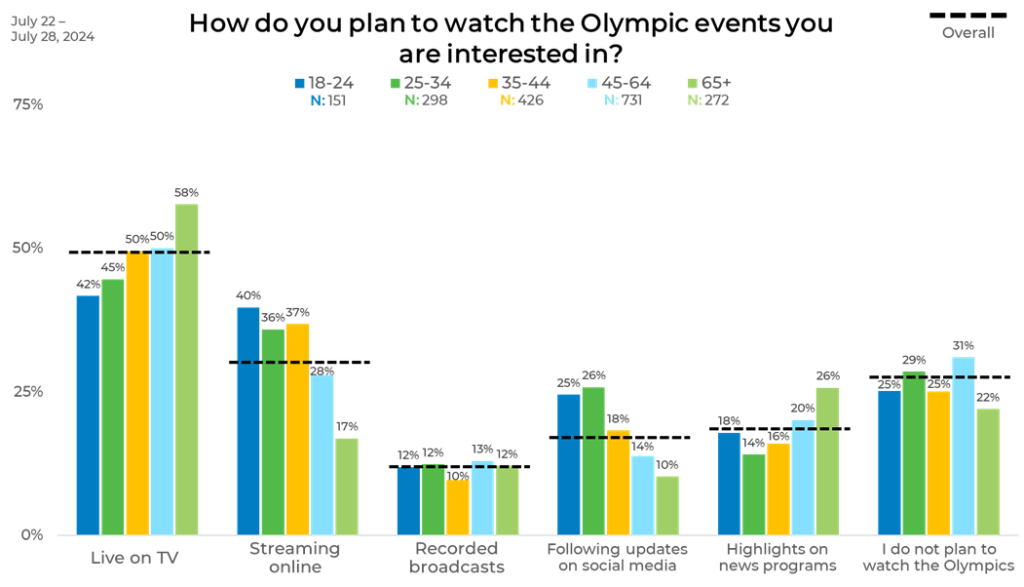
Age breakdown of Olympic viewing preferences reveals distinct trends across generations. Older viewers (65+) are most likely to watch live on TV, with 58% preferring this method, compared to just 42% of the 18-24 age group. Conversely, younger viewers (18-24) show a strong preference for streaming online, with 40% favoring this option, while only 17% of those 65+ choose to stream.
Social media updates are particularly popular among the youngest group (25%), while this interest declines sharply with age, down to 10% for those 65+. In contrast, highlights on news programs are more favored by older viewers, with 26% of the 65+ group watching them, compared to just 14% of the 25-34 age group.
Interestingly, the highest disinterest in watching the Olympics at all is among the 45-64 age group (31%), while the lowest is among the oldest viewers (22%). These trends illustrate the varying ways different age groups engage with the Olympics, with younger viewers leaning towards digital platforms and older viewers sticking to traditional media.
Income
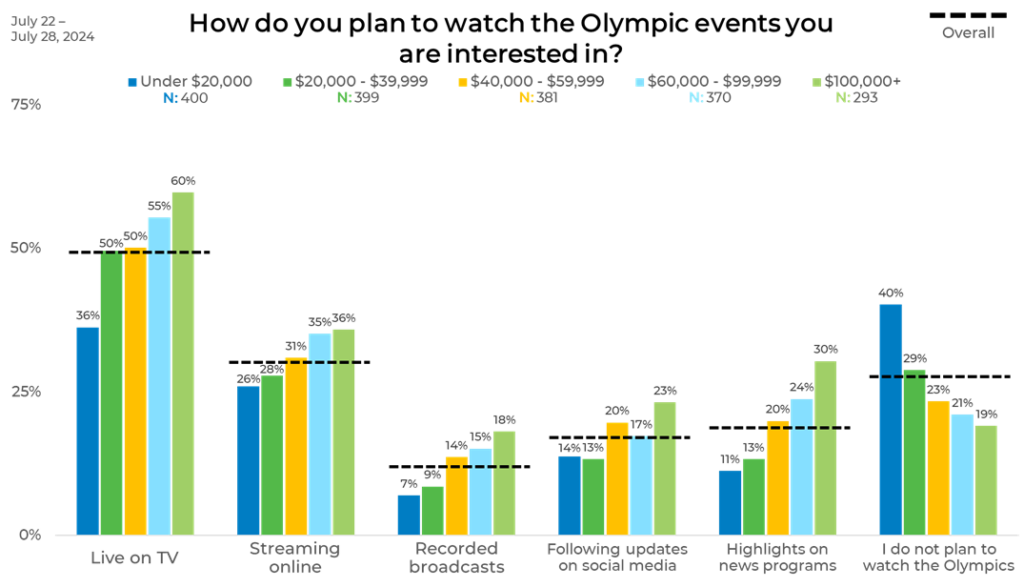
Income levels show notable differences in how people plan to watch the Olympics. Higher income groups ($100,000+) are most likely to watch live on TV, with 60% preferring this method, compared to just 36% of those earning under $20,000. Streaming online is also more popular among higher earners, with 36% of the $100,000+ group choosing this option, versus 26% of the lowest income group.
Recorded broadcasts see increased interest with higher incomes, peaking at 18% for those earning $100,000+, compared to just 7% for those earning under $20,000. Following updates on social media is more common among higher earners (23% in the $100,000+ group) than among lower earners (14% in the under $20,000 group).
Watching highlights on news programs also correlates with higher income, with 30% of the $100,000+ group using this method, compared to 11% of the lowest income group. Notably, 40% of those earning under $20,000 do not plan to watch the Olympics at all, while this figure drops to 19% among the highest earners.
Panel
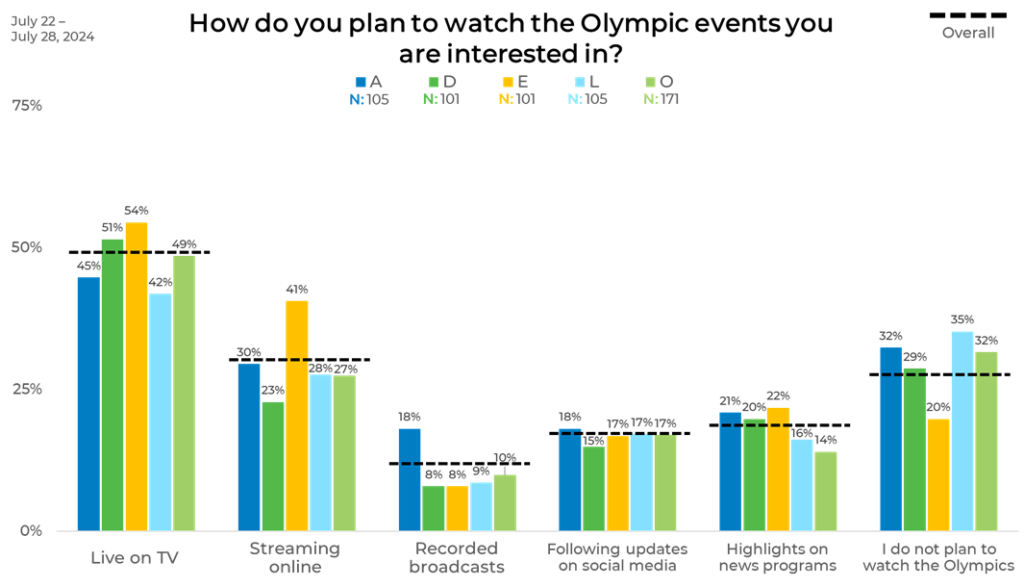
The panel breakdown reveals some striking contrasts in Olympic viewing preferences. Panel E shows the highest engagement with live TV (54%) and online streaming (41%), indicating a strong preference for real-time viewing. In contrast, Panel L has the lowest percentage for live TV at 42%.
Panel A and Panel O both have 32% of respondents not planning to watch the Olympics, closely followed by Panel L at 35%, showing a significant disinterest. Panel E, however, has the lowest disinterest rate at 20%, indicating higher overall engagement.
Recorded broadcasts are notably more popular in Panel A (18%) compared to other panels, where this method hovers around 8-10%. Highlights on news programs have a slight edge in Panel E (22%) and Panel A (21%), while Panel O shows the least interest at 14%.
These insights underline the varying levels of engagement and preferred viewing methods among different panels, with Panel E standing out for its high live and online viewing, and Panel L for its high disinterest.
This is an excellent representation of where quality data sampling matters. At EMI, we prioritize strategically blending sample sources to balance demographics as well as behaviors and attitudes to ensure that we provide the most representative and accurate data. Download The Sample Landscape: 2024 Edition to better understand how panels differ from one another and how they impact your data.


