
Talking Global Focus Group Day with Ashley Le Blanc of Fieldwork
June 21, 2024
Is the Quality Pledge Just a Marketing Ploy?
June 28, 2024In April of 2024 we polled a group of Americans asking them questions around their usage and familiarity of generative AI platforms. Last week we discussed the data around the awareness of generative AI platforms and this week we’re going to be diving into the usage of said platforms.
General
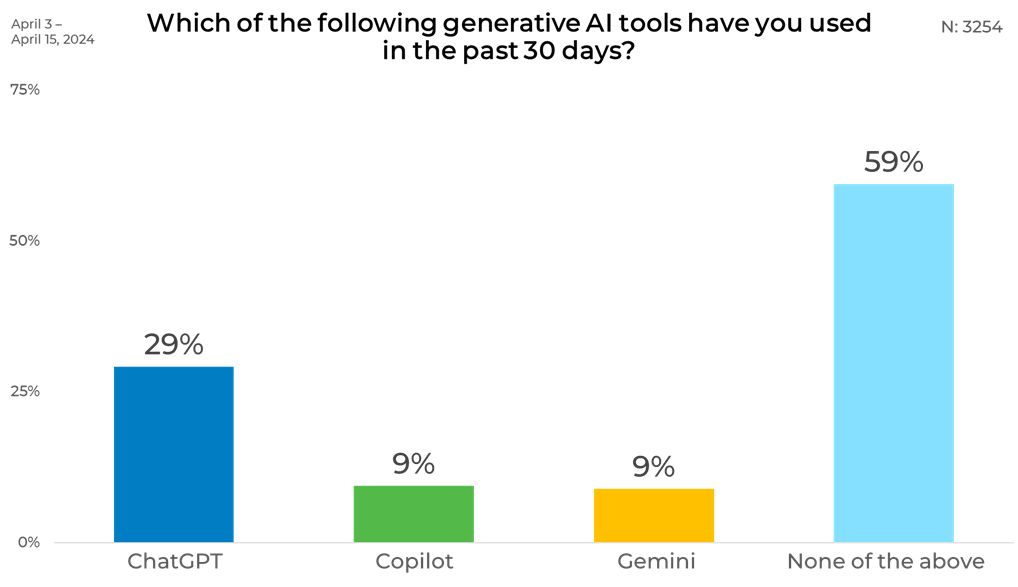
When asked about generative AI tool usage in the past 30 days, ChatGPT stands out as the most frequently used, with 29% of respondents indicating they have used it. Copilot and Gemini follow, both at 9%. Notably, a significant majority—59%—reported not using any of these tools, highlighting a large segment of the population that remains untapped by generative AI platforms.
Gender
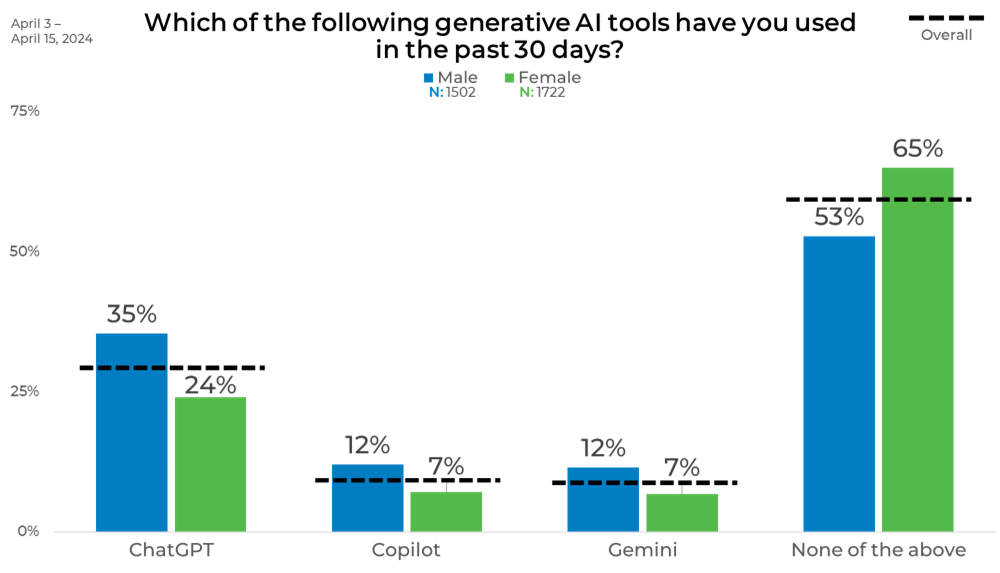
The gender breakdown reveals that males are more likely to have used generative AI tools in the past 30 days compared to females. Specifically, 35% of males have used ChatGPT, while only 24% of females have. Similarly, 12% of males have used both Copilot and Gemini, compared to 7% of females for each tool. Additionally, a higher percentage of females (65%) reported not using any of these tools, compared to 53% of males. This indicates a notable gender gap in the recent usage of generative AI platforms, with males being more engaged than females.
Age
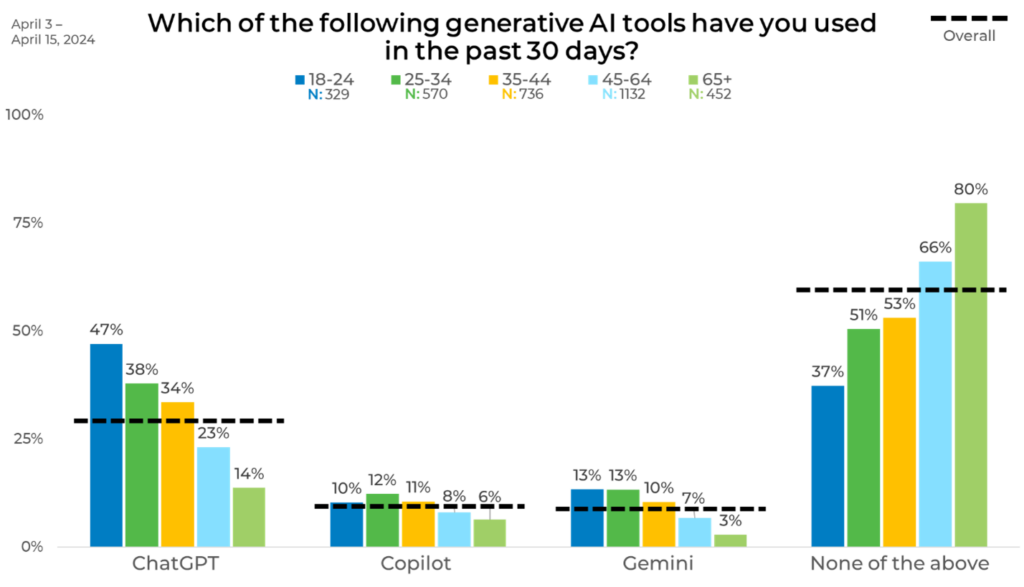
The age breakdown reveals significant differences in the use of generative AI tools over the past 30 days. ChatGPT is most popular among the youngest age group (18-24), with 47% usage, decreasing steadily with age to 14% among those 65 and older. Similarly, Copilot usage is highest among the 25-34 age group at 12% and lowest among those 65+ at 6%. Gemini follows a similar pattern, with 13% usage among both 18-24 and 25-34 year olds, dropping to 3% in the 65+ group.
The percentage of respondents who have not used any of these tools increases with age, from 37% in the 18-24 group to 80% in the 65+ group. This data indicates that younger individuals are more engaged with generative AI platforms, while older adults are significantly less likely to have used these tools recently.
Income
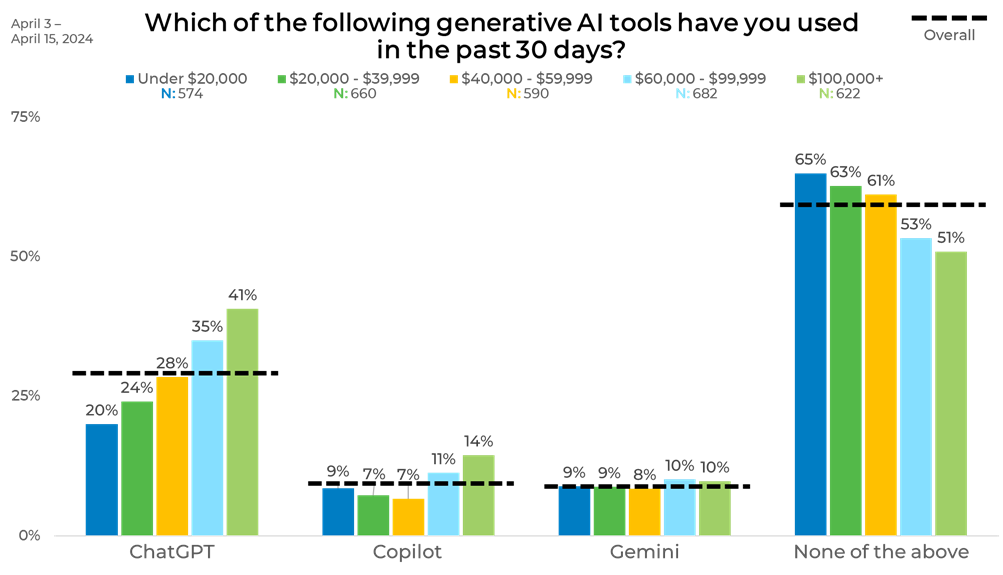
The income breakdown shows a clear correlation between higher income and increased use of generative AI tools. ChatGPT usage rises from 20% among those earning under $20,000 to 41% among those earning $100,000 or more. Copilot follows a similar trend, with 9% usage in the lowest income group, increasing to 14% in the highest. Gemini usage is relatively stable across income groups, ranging from 8% to 10%.
The percentage of respondents who have not used any of these tools decreases with higher income, from 65% among those earning under $20,000 to 51% among those earning $100,000 or more. This data highlights that higher-income individuals are more likely to engage with generative AI platforms, while lower-income individuals are less likely to have used these tools recently.
Ethnicity
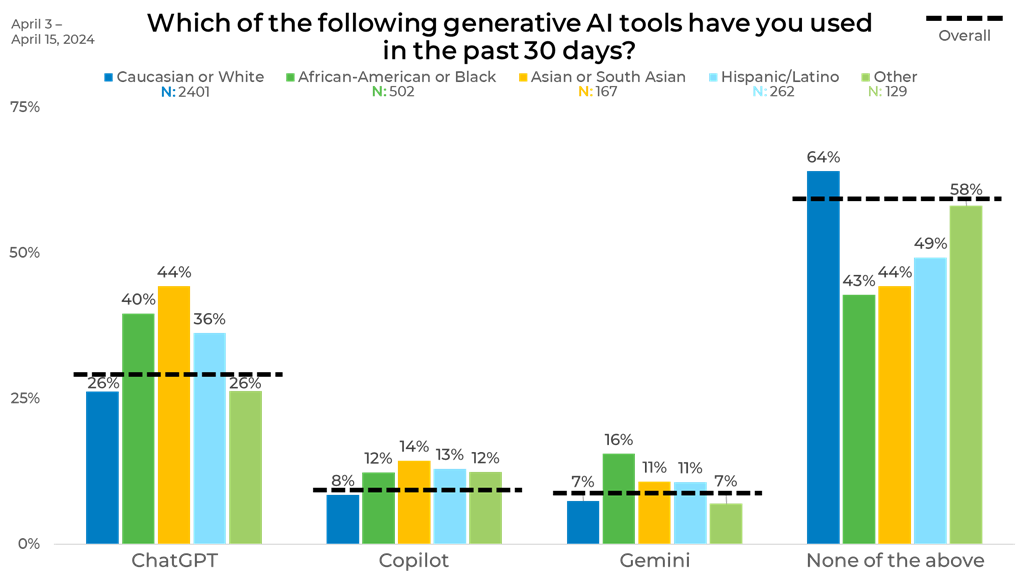
The ethnicity breakdown shows notable differences in the use of generative AI tools over the past 30 days. Asians or South Asians lead in ChatGPT usage at 44%, followed by African-Americans at 40%, Hispanic/Latinos at 36%, and both Caucasians and those identifying as “Other” at 26%. Copilot is most used by Asians or South Asians at 14%, with similar usage among African-Americans (12%) and Hispanic/Latinos (13%), while Caucasians have the lowest usage at 8%.
Gemini is more popular among African-Americans at 16%, followed by Asians or South Asians at 11%, and Hispanic/Latinos at 11%. Both Caucasians and the “Other” group report 7% usage. A significant portion of Caucasians (64%) and those in the “Other” category (58%) report not using any of these tools, compared to lower percentages among African-Americans (43%) and Asians or South Asians (44%).
Panels
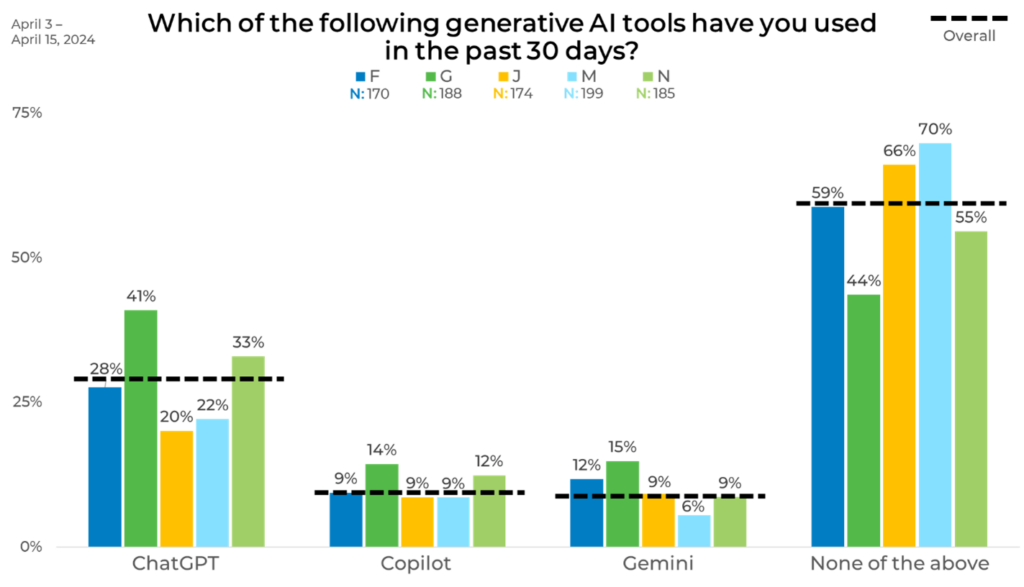
Just from taking one look at the graph below, you can see that the panel breakdown highlights a significant disparity in the usage of generative AI tools. The largest gap being the 26-point difference in the percentage of respondents who have not used any of these tools. Panel G has the lowest percentage of non-users at 44%, while Panel M has the highest at 70%. This stark contrast underscores that Panel G is much more engaged with generative AI platforms compared to Panel M, which shows the least engagement.
This is an excellent representation of where quality data sampling matters. Data At EMI, we prioritize strategically blending sample sources to balance demographics as well as behaviors and attitudes to ensure that we provide the most representative and accurate data.
Download The Sample Landscape: 2024 Edition to understand better how panels differ from one another and how they impact your data.


