Breaking Down Barriers: How Data Reflects Changing Attitudes Towards Mental Health
May 28, 2024
Election Integrity: How Worried Are Voters About Tampering in 2024?
June 6, 2024Its 2024, which means it’s another presidential election year. Political Climate is tense, and the debates are starting any week now. Back in April of this year, we conducted a study asking Americans a few questions about the upcoming election—the first is “How Likely Are You to Vote in The Next Presidential Election? Respondents voted on a scale of 1-10, ticking the number that reflected their likelihood to vote. Here’s what they said.
General
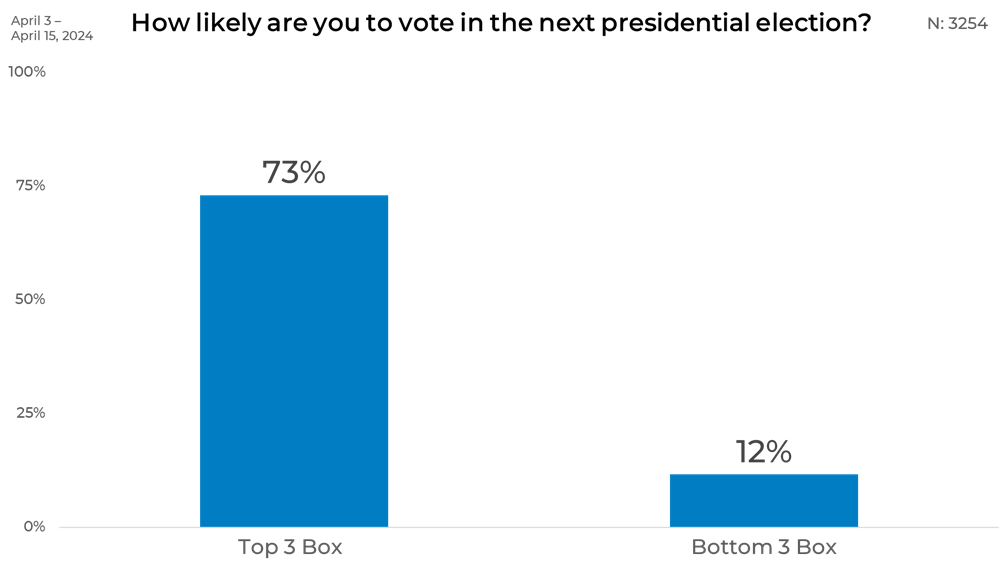
When it comes to the likelihood of voting in the next presidential election, a significant 73% of respondents place themselves in the top 3 box, indicating a strong intention to vote. Conversely, only 12% fall into the bottom 3 box, showing a lack of intention to participate. This substantial difference underscores a highly engaged electorate, with a strong majority expressing their commitment to casting their ballots.
Gender
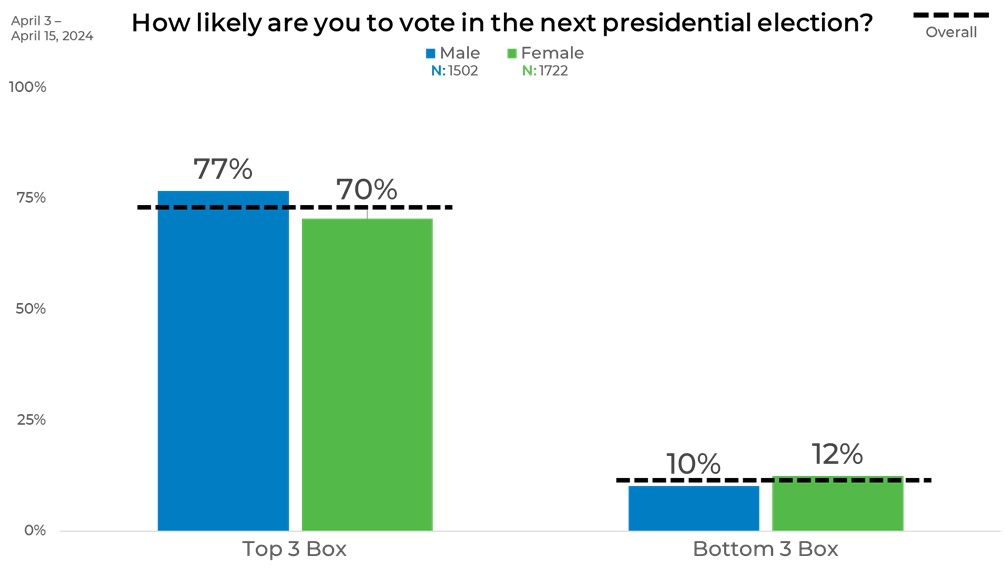
Analyzing the gender breakdown reveals that males are more likely to vote in the next presidential election, with 77% in the top 3 box compared to 70% of females. Additionally, males are slightly less likely to fall into the bottom 3 box, at 10% versus 12% for females. This indicates a higher voting intention among males, highlighting a slight gender gap in electoral engagement.
Political Affiliation
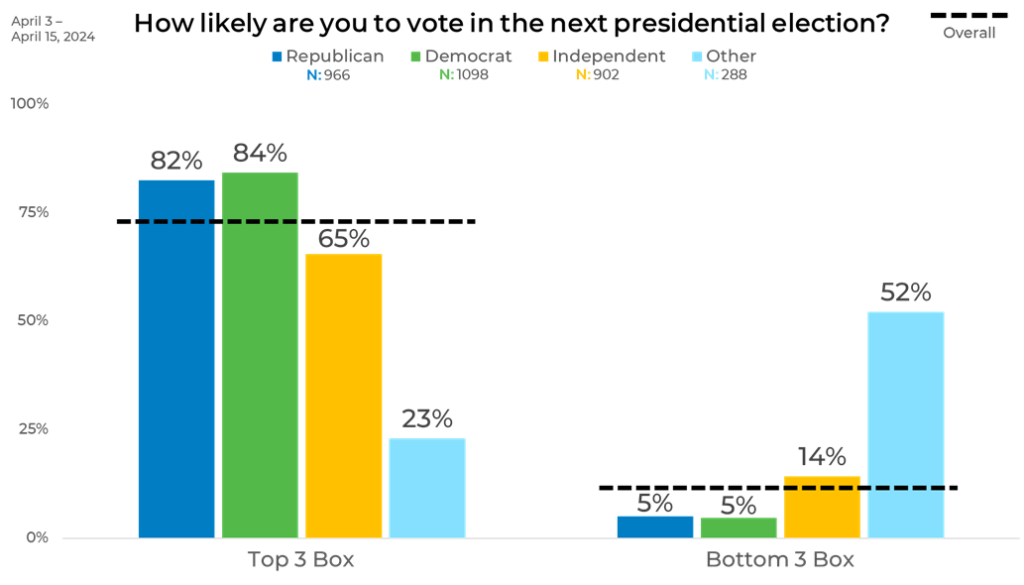
The political breakdown reveals notable differences in voting intentions. Both Republicans and Democrats exhibit high engagement, with 82% and 84% respectively in the top 3 box, and only 5% each in the bottom 3 box. Independents show a moderate level of engagement, with 65% in the top 3 and 14% in the bottom 3.
Age
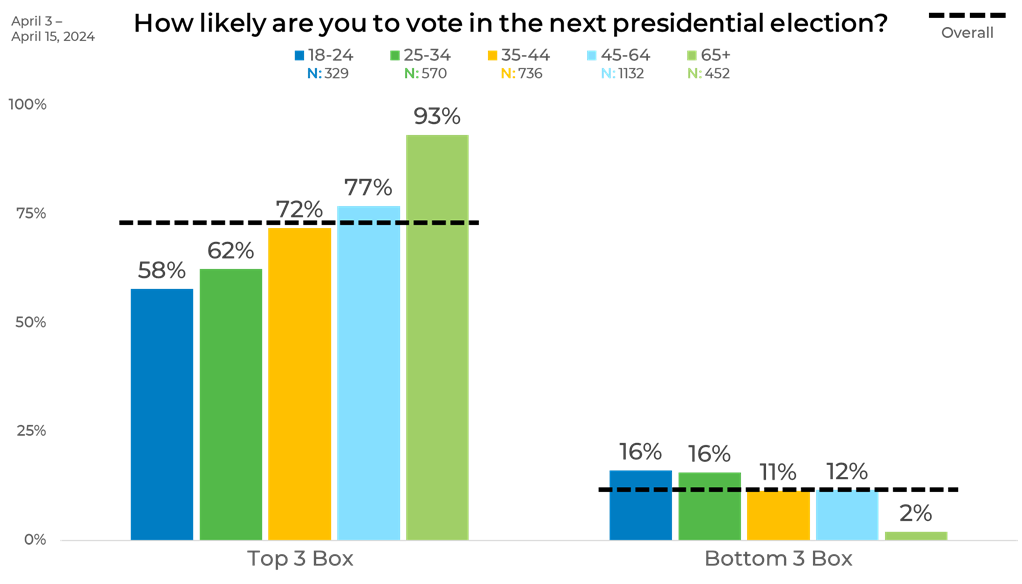
The age breakdown displays a clear trend: voting intention increases with age. The 65+ age group shows the highest engagement, with 93% in the top 3 box and only 2% in the bottom 3 box. Middle-aged adults (45-64) also display strong voting intentions at 77%, with a low 12% in the bottom 3. Younger age groups, particularly 18-24 and 25-34, are less likely to vote, with 58% and 62% in the top 3 box respectively, and both at 16% in the bottom 3. This data underscores a significant age-related gap in electoral participation, with older adults being the most committed to voting.
Income
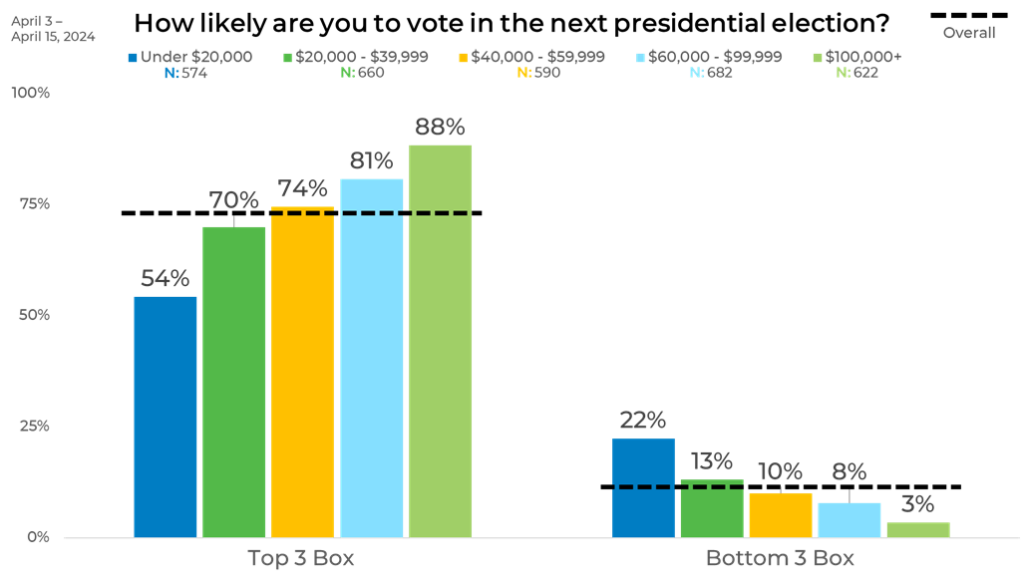
The income breakdown reveals a clear correlation between higher income and increased voting intention. Those earning $100,000+ have the highest likelihood to vote, with 88% in the top 3 box and only 3% in the bottom 3. That said, individuals with an income under $20,000 show the lowest engagement, with 54% in the top 3 and 22% in the bottom 3. As income increases, so does the intention to vote: 70% for $20,000-$39,999, 74% for $40,000-$59,999, and 81% for $60,000-$99,999, with a corresponding decrease in the bottom 3 percentages.
Ethnicity
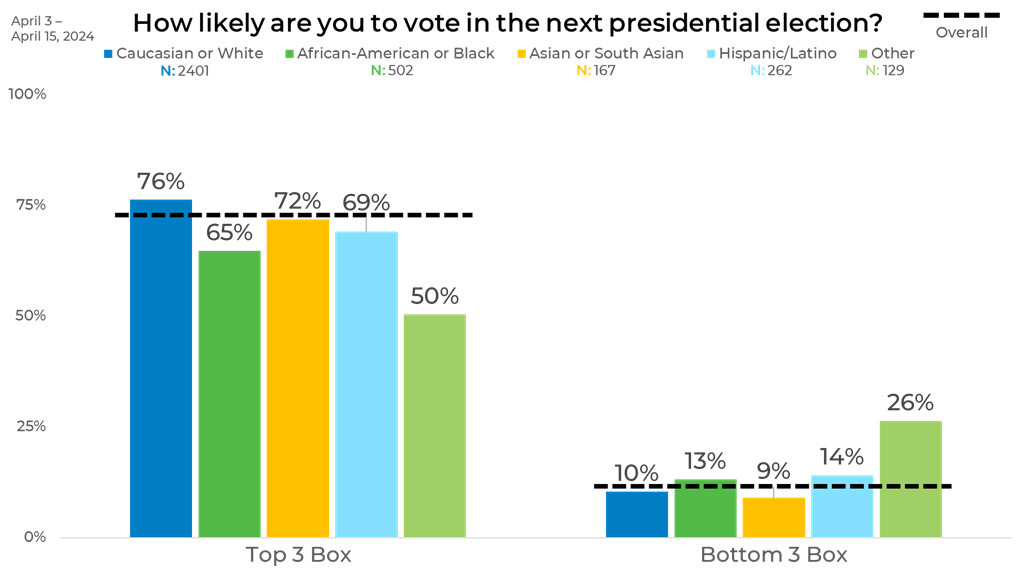
The ethnicity breakdown reveals varying levels of voting intention among different groups. Caucasians show the highest engagement, with 76% in the top 3 box and only 10% in the bottom 3. Asians or South Asians follow closely with 72% in the top 3 and 9% in the bottom 3. African-Americans and Hispanics/Latinos show moderate engagement, with 65% and 69% in the top 3, and 13% and 14% in the bottom 3, respectively.
Panels
The panel breakdown shows the varying answers in a general sense between the different panels who were surveyed. Panel P has the highest engagement, with 85% in the top 3 box and only 7% in the bottom 3. Panel A also shows strong engagement at 74% in the top 3 and 12% in the bottom 3. Panels C and F are similar, with 68% and 72% in the top 3, respectively, and both at 12% in the bottom 3. Panel J has the lowest voting intention, with 59% in the top 3 and 16% in the bottom 3. This data highlights a notable disparity in electoral engagement across different panels, with Panel P being the most committed to voting and Panel J the least.
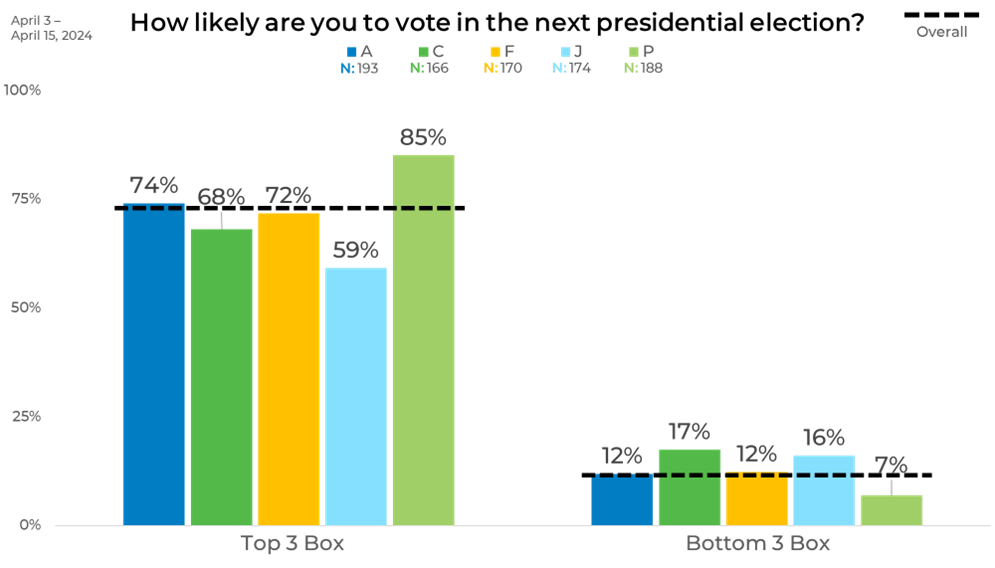
It's important to note just how much a quality data sample can impact the outcome of your research. This is presented visually here. At EMI, we prioritize strategically blending sample sources to balance demographics as well as behaviors and attitudes to ensure that we provide the most representative and accurate data.
Download The Sample Landscape: 2024 Edition to better understand how panels differ from one another and how they impact your data.

