
Do You Live Under a Rock? A Profile of People Who Are Unaware of McDonald’s or Coca-Cola
March 20, 2024
Recapping Quirks Chicago
April 12, 2024Spring break vacations are considered a tradition by many, but how many actually take a trip? With the spring break season winding down, we wanted to explore what people did, if anything, during this widely recognized pause in the calendar.
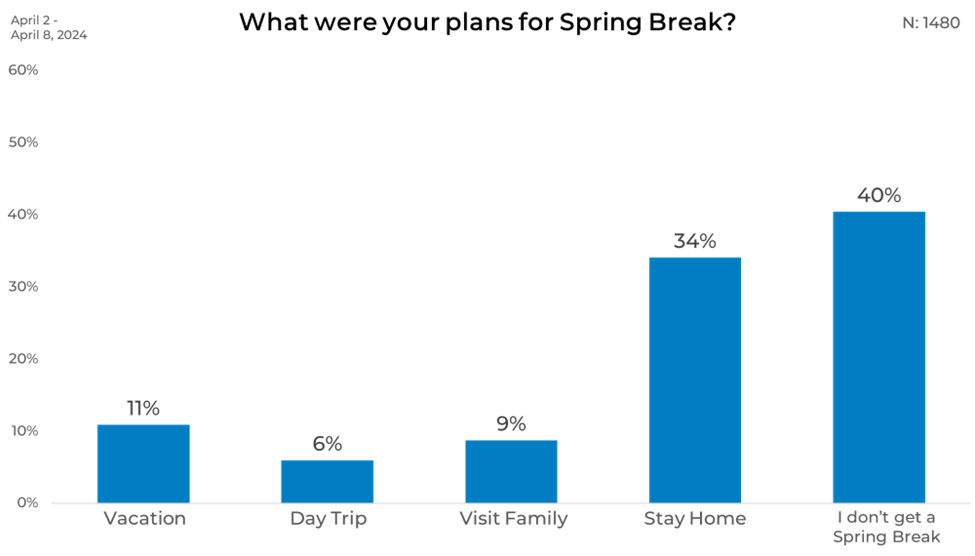
Spring Break, a time synonymous with relaxation and adventure, revealed that maybe the view of spring break that is had isn’t quite true. According to the data, a significant 40% of respondents find themselves in the position of not having a Spring Break, spotlighting the varied schedules and commitments. Meanwhile, the allure of home's comfort seems to resonate with 34% of participants, making "Stay home" the most popular choice among those with Spring Break plans. On the more adventurous side, 11% aim to break the routine with a vacation, while 6% opt for the simplicity and charm of a day trip. Visiting family, a blend of travel and home's warmth, attracts 9%, highlighting the enduring value of family connections.
Gender
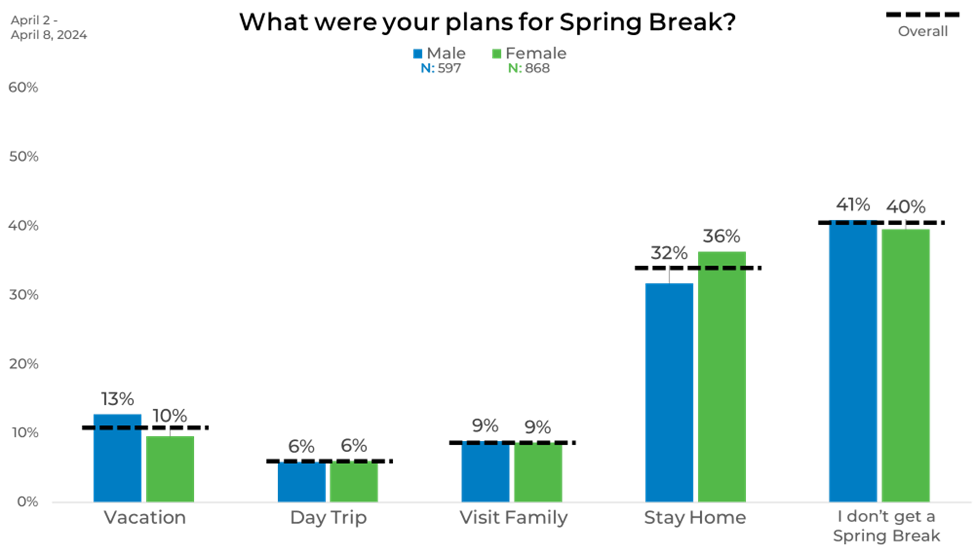
When breaking down the results along gender lines, the allure of vacations seems slightly more pronounced among males, with 13% opting for a getaway compared to 10% of females. Day trips and family visits stand as unanimous choices across the board, each garnering 6% and 9% respectively from both genders, suggesting these options hold a universal appeal, or perhaps they represent a middle ground of commitment and familial duty.
The decision to stay home illustrates a subtle divergence: 36% of females prefer the sanctuary of their own space, as opposed to 32% of males. Most telling, however, is the similarity in responses to the option of not having a Spring Break, with 41% of males and 40% of females indicating they're tethered to their routines, irrespective of the season.
Age
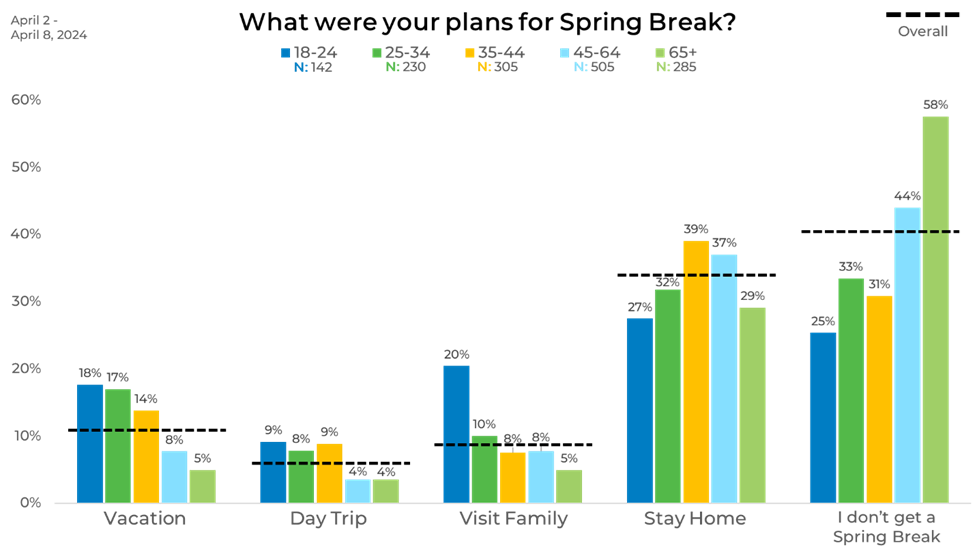
Spring Break plans reveal a fascinating shift with age, showing how preferences evolve from youth to retirement. Young adults (18-24) lead the pack in vacationing (18%), with interest in travel gradually declining to just 5% among those 65 and older. Visiting family is most popular with the youngest adults at 20%, decreasing with age, while the trend to stay home grows stronger, peaking at 39% among those aged 35-44 before slightly decreasing.
The concept of not having a Spring Break becomes more common as people age, starting at 25% for the youngest group and surging to 58% for seniors.
Income
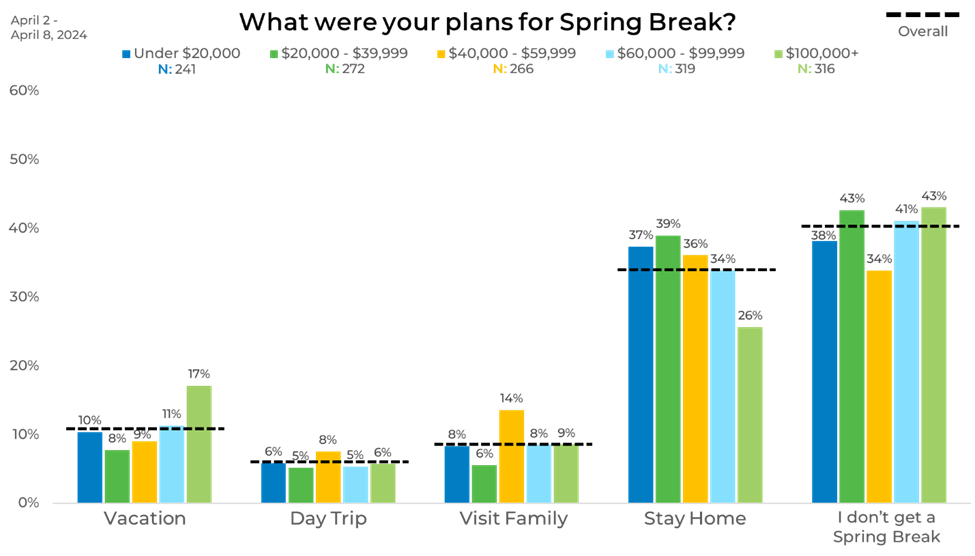
Income levels play a pivotal role in shaping Spring Break activities, revealing a direct correlation between income and the likelihood of taking a vacation. Those earning over $100,000 are the most likely to go on vacation (17%), while only 10% of individuals earning under $20,000 plan to do so. Conversely, the tendency to stay home during Spring Break declines as income increases, from 37% among the lowest earners to 26% for the highest income bracket.
The rate of people not getting a Spring Break also varies with income, but in an intriguing pattern: it's particularly low among the lowest income group (>$20,000) and incomes between $40,000-$59,999, at 38% and 34% respectively.
Ethnicity
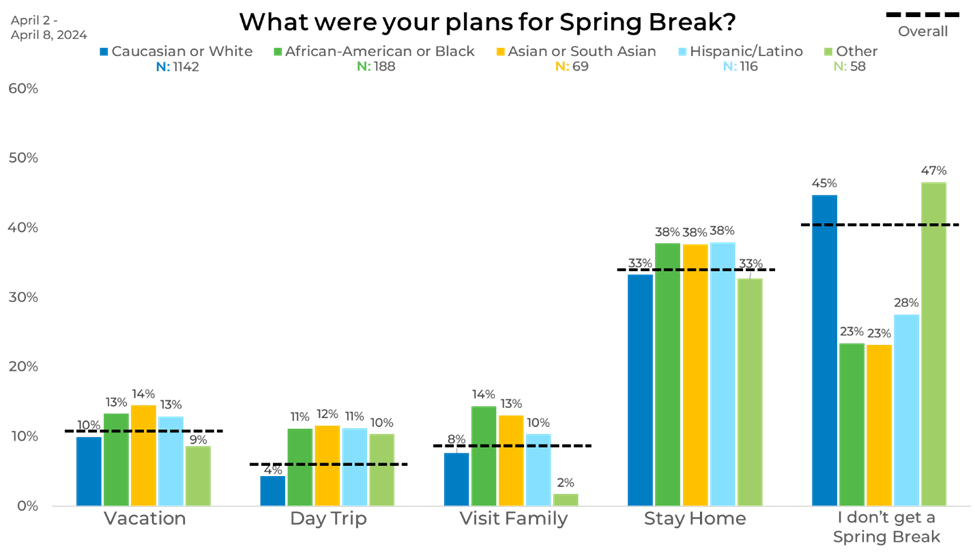
Spring Break plans also differ across ethnicities. Asian or South Asian and Hispanic/Latino groups show a similar enthusiasm for vacations and day trips, with 14% of Asians or South Asians and 13% of Hispanic/Latinos opting for vacations, and day trips appealing to 12% and 11% respectively.
African American respondents stand out with a higher inclination towards visiting family (14%) and taking day trips (11%). Conversely, the Caucasian group has a notable 45% reporting they don't get a Spring Break at all.
The tendency to stay home is quite evenly spread across African American, Asian or South Asian, and Hispanic/Latino groups, all at 38%, compared to 33% among Caucasian.
Region
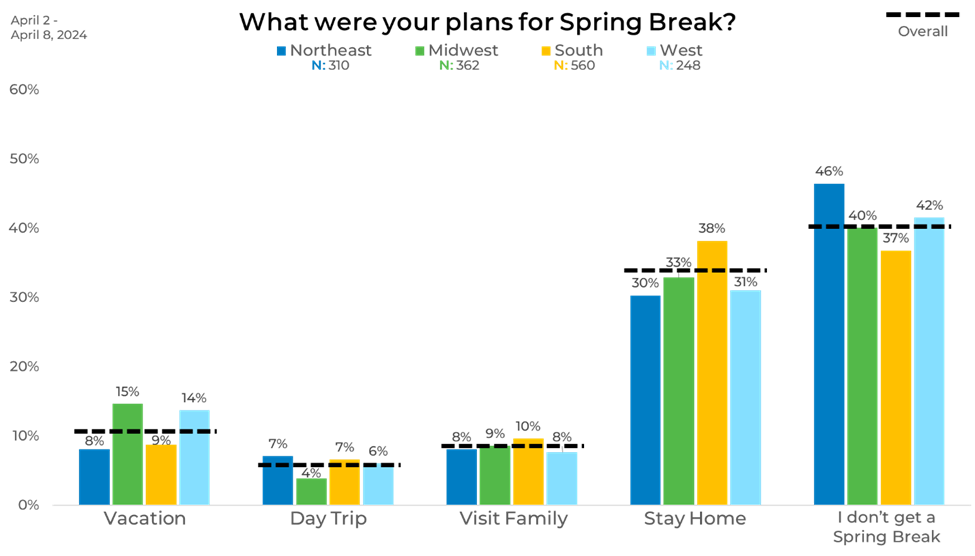
There are some regional differences regarding Spring Break plans. The standout insight is the high percentage of individuals without a Spring Break, peaking in the Northeast at 46% and lowest in the South at 37%.
Among those with plans, the inclination to stay at home dominates, particularly in the South, where 38% opt for a staycation. In contrast, the Midwest and West exhibit a notable zest for travel, with 15% and 14% respectively planning vacations.
Panel
Breaking down Spring Break plans by panel, the most striking contrast lies in the proportion of respondents who state they don't get a Spring Break, with Panel E standing out at 49% - 17% more likely than Panel D. This really highlights the differences in panels, and how you can get different results on your studies depending on your panel selection.
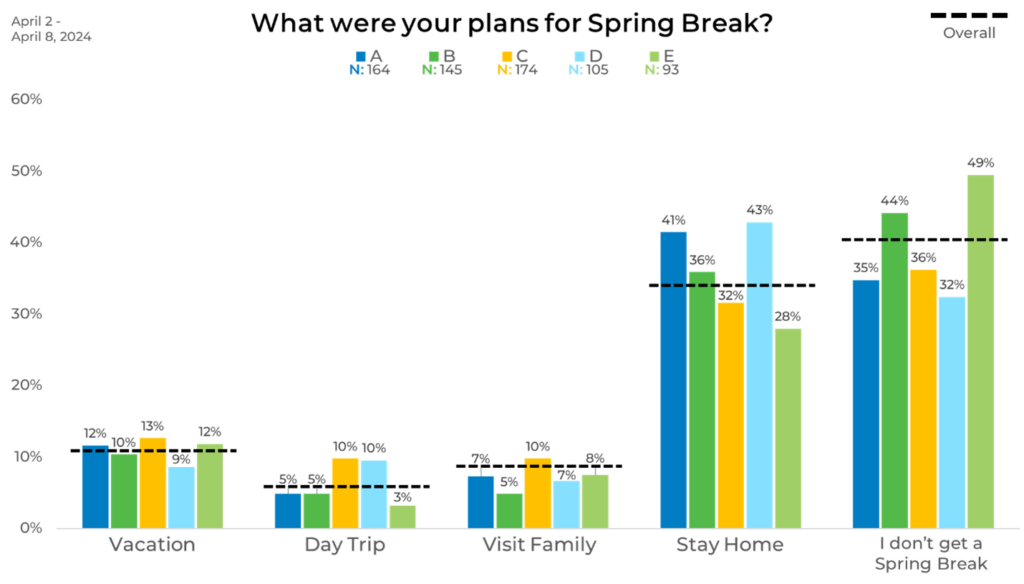
As you can see, data can vary significantly across demographics and by panel, impacting your data. That is why strategically blending sample is the best practice to ensure you are accounting for distributed demographic, as well as attitudinal and behavioral balance.
Learn more about panel differences in our annual report on the sample industry, The Sample Landscape: 2024 Edition.


