
The Big Qualtrics Acquisition, Melanie’s New Role, and Halloween Candy
October 22, 2025
When Ho-Ho-Ho Turns to Oh-No: How to Field Online Surveys Through the Holiday Frenzy (2025 Edition)
November 3, 2025
Over the past two years, air travel has seen a steady rebound, even returning to pre-pandemic levels, but the demographics of who is traveling have changed. Whether for business or leisure, the decision to take a round-trip flight reflects a mix of economic conditions, personal comfort levels, and lifestyle choices. We took a look into who has traveled at some point over the last 2 years, they they type of travel the took to better understand what the demographics of air travelers look like now.
Let’s dive in:
Traveled
Overall
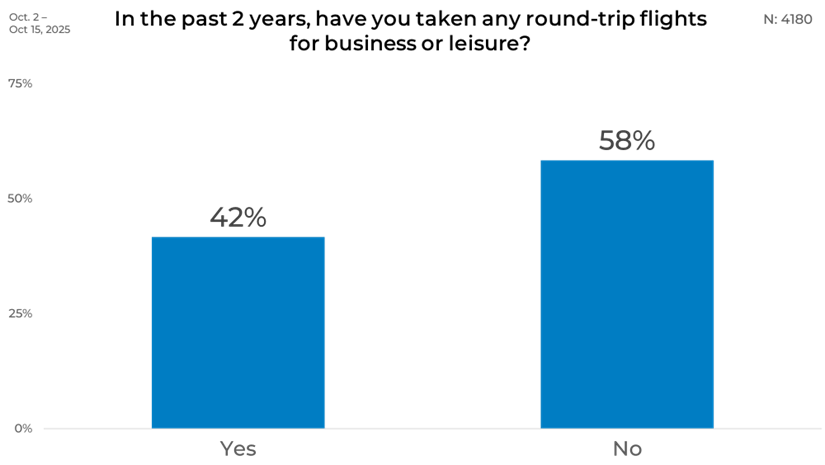
Across all respondents, 42% reported taking at least one round-trip flight for business or leisure, while 58% had not flown during that period. This indicates that fewer than half of adults participated in air travel recently, showing that flying remains a selective activity rather than a universal one.
Gender
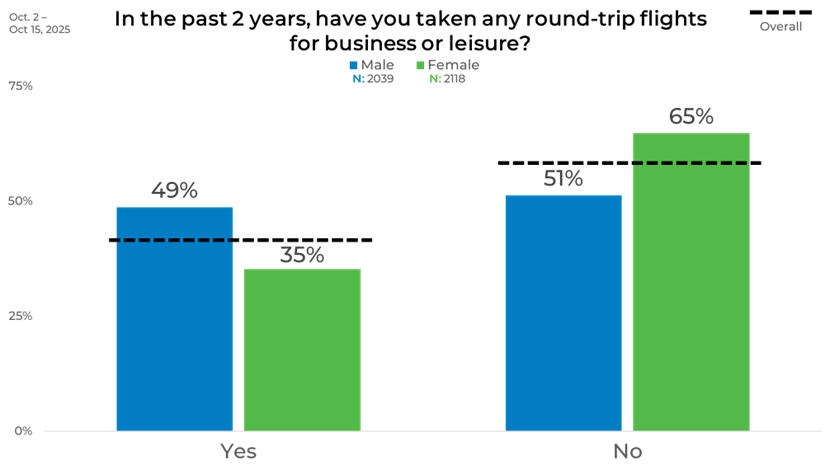
Gender differences reveal a clear divide in travel behavior. 49% of men reported taking a round-trip flight, compared to 35% of women. There’s a stronger travel presence among men, while women show lower participation in air travel overall.
Age
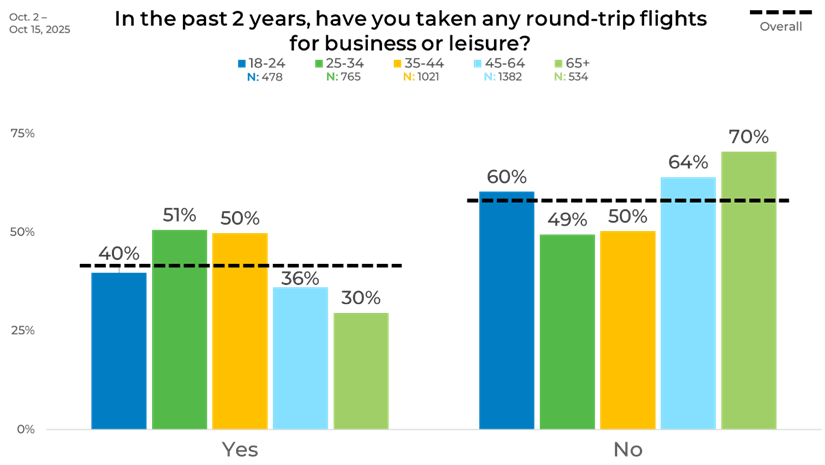
Age is a significant factor in flight participation. Younger adults are more likely to have flown, with 51% of those aged 25–34 and 50% of those aged 35–44 reporting air travel. By contrast, only 30% of those aged 65 and older reported taking a round-trip flight. The sharp decline among older respondents may reflect health considerations or shifting priorities post-pandemic. Among those aged 18–24, a moderate 40% reported flying.
Income
Income levels show one of the strongest divides in our data. Only 21% of those earning under $20,000 had flown, compared to 72% of those earning $100,000 or more. Unsurprisingly, air travel rises sharply with income, climbing steadily across each bracket. This correlation shows that income levels clearly affect access to both leisure and business travel, with higher earners significantly more likely to fly than lower-income respondents.

Region
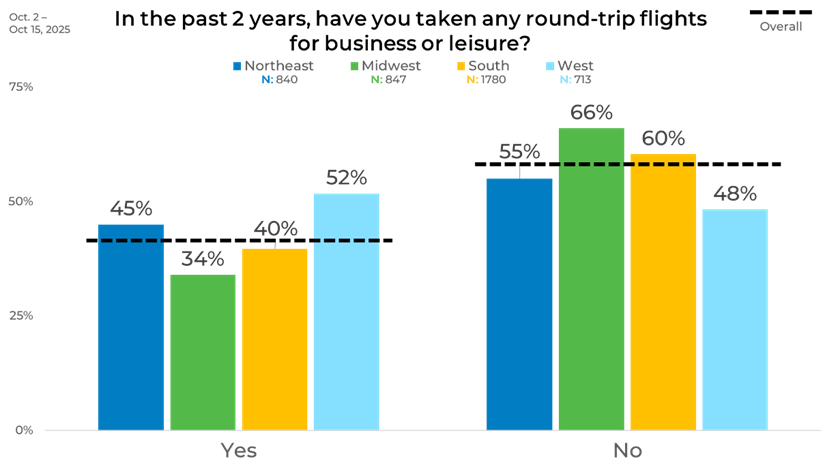
When we break down the data by region, we found that theWest (52%) leads in flight activity, followed by the Northeast (45%), South (40%), and Midwest (34%). This pattern aligns with geographic factors such as distance between major cities and access to large airports. Western residents appear the most mobile, while Midwesterners have taken to the air less often.
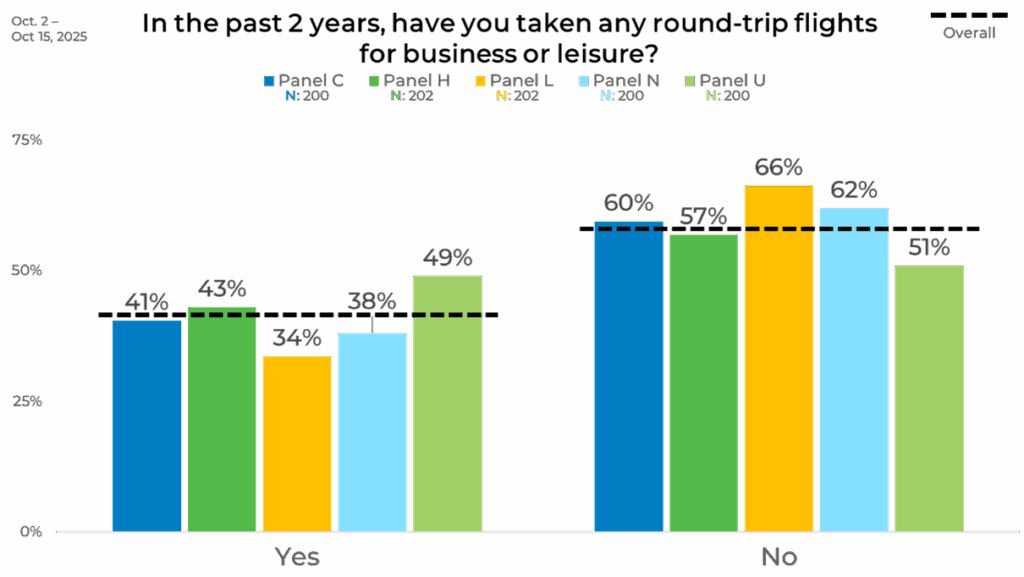
Panel
Panel results show clear differences across data sources, highlighting the largest gap of 15 percentage points between Panel L (34%) and Panel U (49%). The other panels fall between 38% and 43%, showing moderate variation.
Trip Type
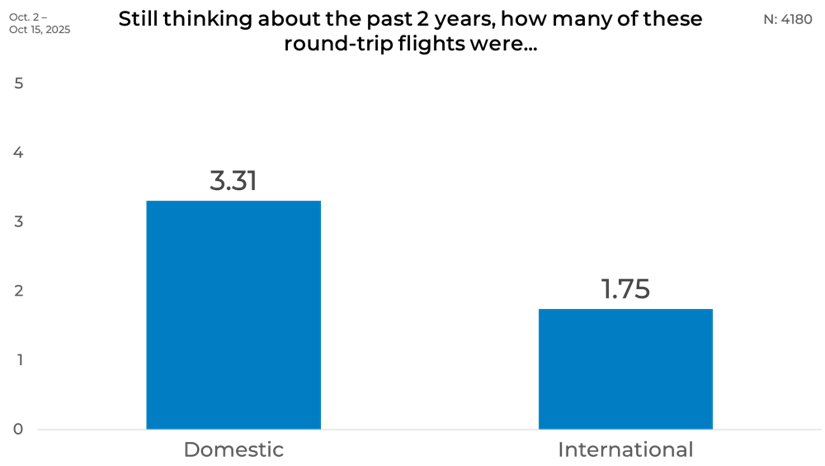
After identifying who has been flying over the past two years, we wanted to break down the type of air travel these travelers took, and the average number. Among those who flew in the past two years, the average traveler took 3.31 domestic round-trip flights and 1.75 international flights. This means domestic trips continue to dominate travel activity, with most travelers flying within the country far more often than abroad. While international travel has begun to recover, the higher domestic average shows that many still prefer shorter, regional journeys over long-haul trips.
Gender
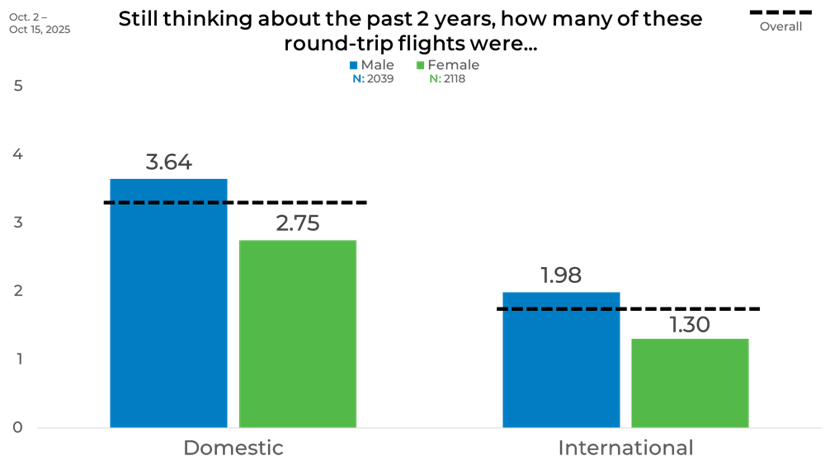
Gender differences reveal notable variation in flight frequency and type. Men reported an average of 3.64 domestic and 1.98 international flights, while women averaged 2.75 domestic and 1.30 international flights. The higher averages among men reflect greater overall flight activity, consistent with earlier findings showing that men are more likely to have traveled by air in general.
Age
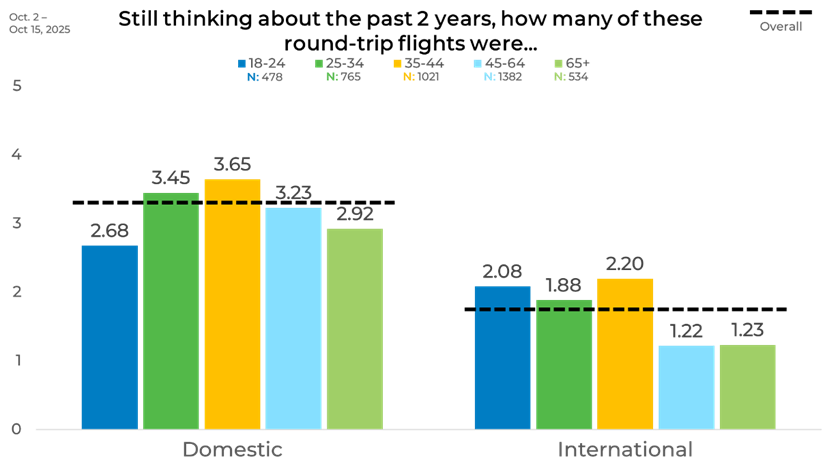
We know that those aged 25-44 reported the highest levels of air travel over the last two years, so naturally they also reported the highest number of domestic flights (average of 3.65. What was interesting was that while the 35–44-year-olds had the highest average international flights, 18-24-year-olds reported the second highest average number of international flights.
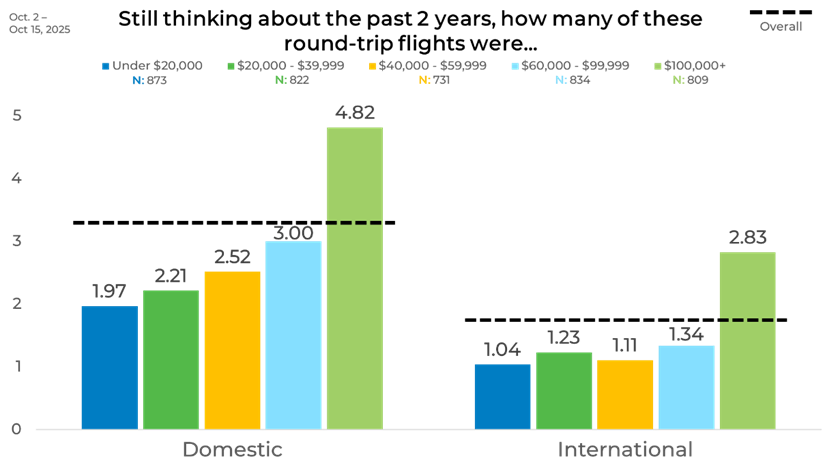
Income
Unsurprisingly, those earning $100,000 or more reported the highest average number of both domestic and international flights – 4.82 domestic and 2.83 international respectively. Similar to how we saw the percentage of respondents who have travelled in the last 2 years increase with income, the average number of flights taken follows this trend.
Region
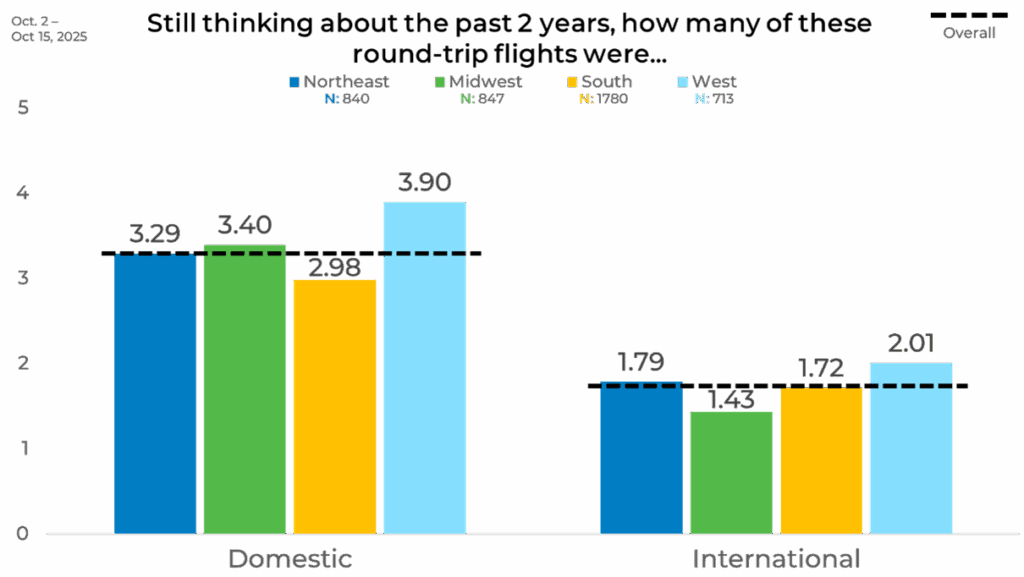
We saw a more pronounced difference in the average number of trips taken when we broke the data down by region. Domestically, respondents in the West reported taking almost one more trip on average (3.90) than respondents in the South.
Ethnicity
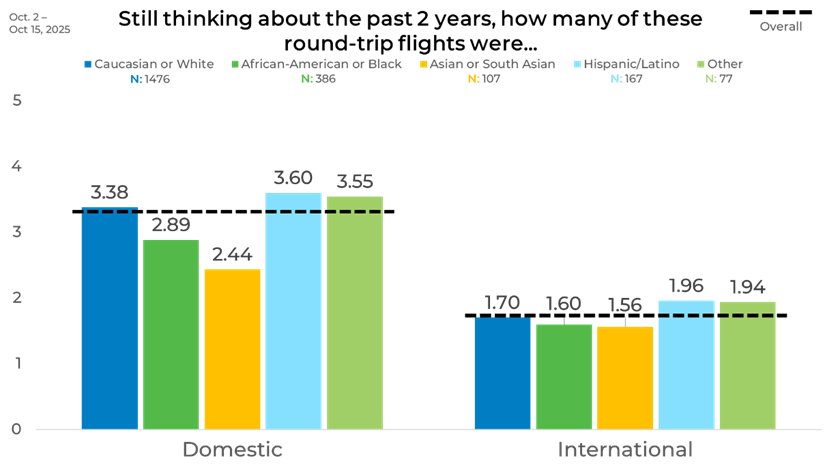
There were significant variations in the average number of flights taken when we looked at the data by ethnicity, particularly domestic flights. The largest difference was with Hispanic versus Asians. Hispanics/Latinos took 1 more flight on average domestically than Asians (3.60 versus 2.44).
Panel
The largest variations we found were when we broke the data down by panel source. Domestic averages varied from 2.19 in Panel P to 5.09 in Panel F, a difference of nearly three flights. For international travel, averages ranged from 1.15 in Panel P to 3.27 in Panel F.
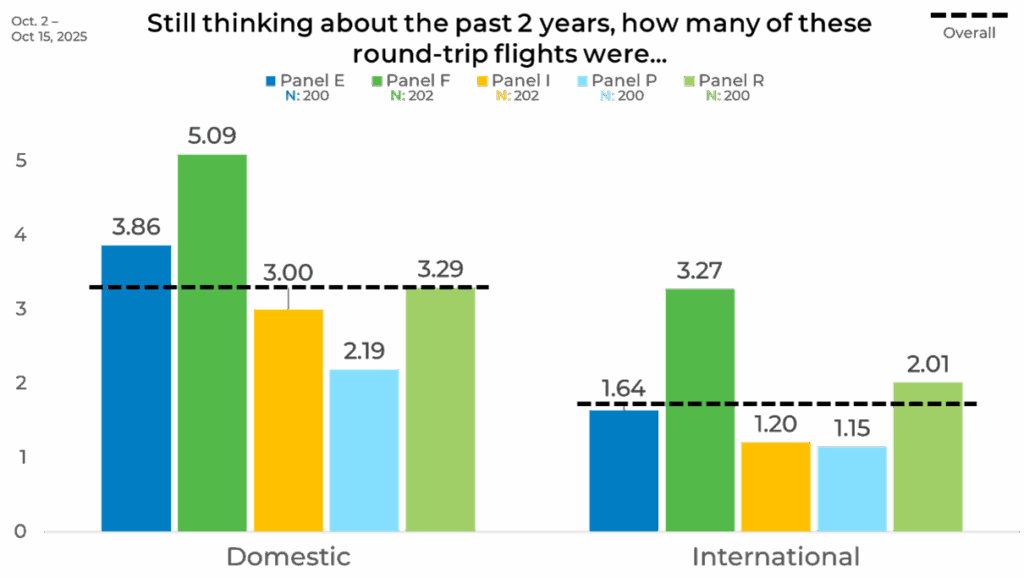
The differences in the data emphasize the importance of strategically blending your sample on your research studies. Doing so ensures you mitigate any potential panel bias that could skew your results and lead to inaccurate insights.
Learn more about strategic sample blending by clicking the button below.

